TSP Contribution Allocation Excel – Free Template (2026)
0
Free download
Track FERS pay-period contributions, TSP allocations, agency matching, service credit, pension estimates, and readiness status in Excel.


This FERS retirement savings tracker is an Excel workbook for recording pay-period salary, Traditional and Roth TSP percentages, agency contributions, service credit, and estimated pension income. It contains a Contribution Tracker with 100 prepared rows, a Dashboard with three charts and planning assumptions, and an Instructions tab.
Use it during each payroll cycle to see how employee contributions, the agency automatic 1% contribution, and estimated matching affect total TSP savings. The workbook also compares each record with the Dashboard target contribution rate and labels it On Track or Review Contribution.
A federal employee can use this tracker after each pay-period close to connect the amount on a payroll statement with long-term retirement planning. A benefits coordinator or bookkeeper supporting a federal office can also use it to review records by employee, agency, location, and pay-period end date without changing the workbook's formulas.
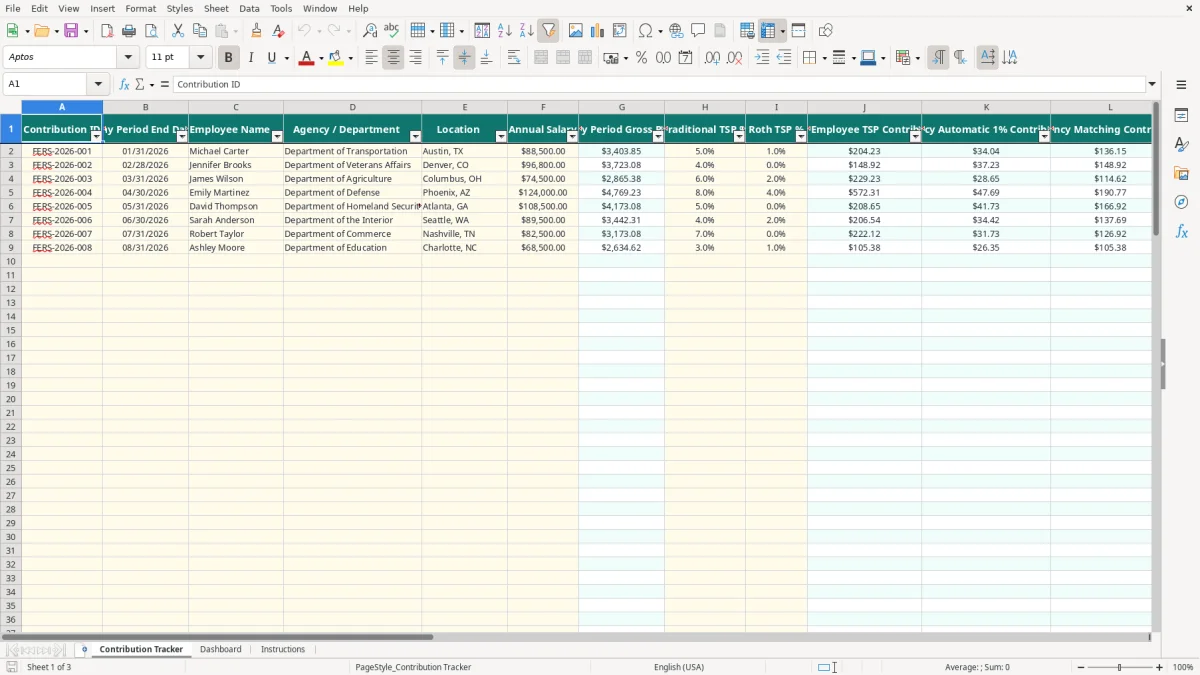
Suppose an employee earns $88,500 annually and contributes 5% to Traditional TSP plus 1% to Roth TSP. With the workbook's 26-pay-period assumption, gross pay is $3,403.85 per period, and total employee TSP savings are about $204.23 before agency contributions. The Contribution Tracker records both percentages instead of hiding the allocation inside one total.
Image 1 shows the Contribution Tracker layout. Columns A through F hold identifying and salary inputs; G calculates pay-period gross pay; H and I hold the two TSP rates; J through Q calculate funding, service credit, pension, and contribution-rate measures; R displays the monthly status.
During a monthly or payroll review, you can compare employee TSP contributions with the agency automatic contribution and matching contribution. The sample rows include departments such as Transportation, Veterans Affairs, Agriculture, and Defense, but the prepared table also provides rows through row 101 for additional records.
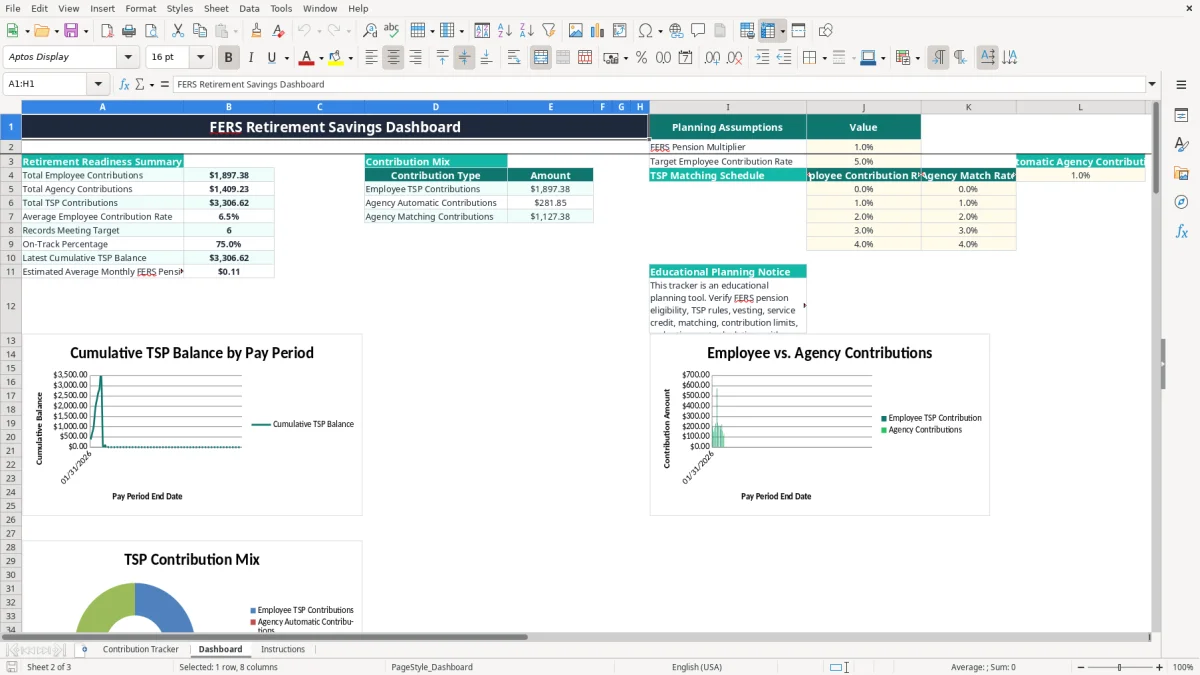
The Dashboard summarizes the full tracker rather than serving as a second entry sheet. Image 2 shows the Retirement Readiness Summary, Contribution Mix, Planning Assumptions, and the prepared chart source area. This makes it useful for a benefits meeting or a personal review before changing a contribution election.
A federal employee considering a promotion, transfer, or retirement date can review salary, service-credit entries, estimated pension income, and cumulative TSP savings together. Treat the pension figure as a planning estimate: the workbook applies the entered salary and service credit to the editable 1.0% multiplier assumption; it does not determine eligibility or an official annuity.
This workbook is a planning model, not an official federal retirement calculator. The Instructions tab specifically directs you to verify FERS eligibility, TSP rules, vesting, service credit, agency matching, contribution limits, and retirement calculations through current official sources before making an election.
The Dashboard starts with a FERS Pension Multiplier of 1.0%, stored as 0.01. For example, annual salary of $100,000 multiplied by 1.0% and by 25 years of service produces $25,000 of estimated annual pension income, or $2,083.33 per month. The workbook's service-credit column is calculated from salary and pay-period data; it is not a certification of creditable federal service.
FERS pension eligibility and computation can involve service history, retirement category, age, high-3 average pay, survivor elections, and other provisions. Do not replace an official estimate from the Office of Personnel Management with the Dashboard number.
Traditional TSP contributions generally receive pre-tax treatment, while Roth TSP contributions generally use after-tax pay. The tracker adds the two employee percentages for its contribution-rate test, then applies the Dashboard's editable matching schedule with VLOOKUP using approximate matching.
The sample schedule contains employee rates of 0%, 1%, 2%, 3%, and 4%, with matching rates displayed in the adjacent column. The automatic agency contribution is separately set at 1.0%. These are workbook assumptions, not a promise that every employee receives the same amount; confirm the current federal plan provisions and eligibility rules.
Compare each row with your official payroll statement and keep supporting records with your retirement files. Annual TSP limits, catch-up provisions, agency matching, and tax treatment can change; verify the applicable 2026 limits and instructions from official federal sources before using the tracker for a contribution decision.
The workbook does not calculate federal income tax, FICA, Form W-2 wages, loan repayments, withdrawals, vesting schedules, or Social Security benefits. It also does not connect to payroll, TSP, or OPM systems, so its output must be reconciled to those records.
The most expensive spreadsheet errors usually begin with a copied payroll number that was never checked. A benefits file can look complete while its salary, contribution rate, or pay-period date no longer matches the employee's actual record, producing a misleading cumulative balance and pension estimate.
The tracker divides annual salary by 26. If you enter $96,800, the calculated gross pay is $3,723.08 per pay period. A salary entered as $86,800 instead changes gross pay by about $384.62 per period, and every employee and agency contribution tied to gross pay changes with it.
Do not use the cumulative TSP balance as an account statement. It is a running total of the workbook's calculated contributions. Missing one $250 contribution understates the displayed balance by $250; entering the same pay period twice overstates it by the same amount.
Entering 5 instead of 5% creates a 500% rate if the cell is treated as a raw number. On $3,500 of gross pay, the intended employee contribution is $175; the mistaken value can produce $17,500. Use the percentage format and inspect the resulting dollar amount in column J before accepting the row.
The matching result uses the rate table on the Dashboard. If someone changes the schedule without preserving ascending employee-rate thresholds, approximate VLOOKUP can return an incorrect match. For this workbook, changing assumptions without documenting the date and source is worse than leaving a visible note that the estimate needs review.
On Track means the calculated employee contribution rate meets or exceeds the Dashboard target, currently 5.0%. It does not mean the employee is on track for a desired retirement income, has satisfied FERS service requirements, or has captured every available plan benefit.
Another failure occurs when users overwrite formulas in columns G and J through R. A single deleted formula can make one row appear plausible while breaking the comparison behind the Dashboard totals. Protect formula columns or keep an untouched backup before making structural edits.
The easiest way to keep this workbook alive is to update it immediately after the payroll record is available, not at year-end. Set a recurring calendar task for the same day each pay period, enter one row, compare the calculated employee contribution with the payroll statement, and then review the Dashboard summary.
For example, 26 completed updates at $200 of employee contributions would show $5,200 of employee funding before agency amounts. That simple comparison gives you a useful control total without pretending to replace the TSP account balance.
Limit assumption changes to the Dashboard cells for the pension multiplier, target employee contribution rate, automatic agency contribution, and matching schedule. Record the effective date and source in your own notes because the workbook does not provide an audit-log feature.
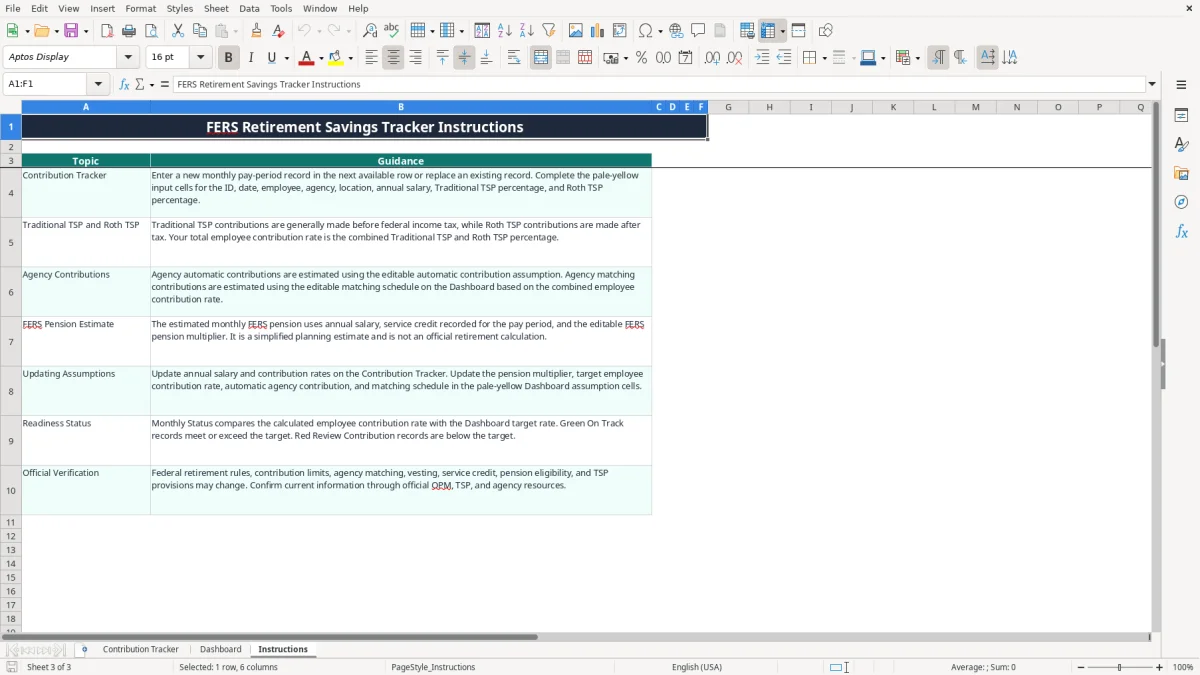
Use the Instructions tab when training another reviewer. Image 3 shows the guidance topics, including Contribution Tracker entry, Traditional and Roth TSP treatment, agency contributions, pension estimates, assumptions, readiness status, and official verification.
The table has 100 prepared operational rows. Move to a payroll or retirement administration system when you need secure employee access, audit history, automated imports, approval controls, or records for more than 100 pay-period entries. Excel is appropriate for a personal planning file or a small review process; it is not a substitute for an agency's payroll system or TSP recordkeeper.
It calculates pay-period gross pay, employee TSP contributions, agency automatic and matching contributions, total TSP contributions, cumulative TSP balance, FERS pension service credit, estimated monthly pension, contribution rate, and Monthly Status.
The Contribution Tracker contains a formatted table from A1:R101, with 100 prepared data rows from row 2 through row 101. The workbook does not include an automated expansion feature beyond that prepared range.
Column G divides annual salary by 26. For an $88,500 salary, the result is $3,403.85 per pay period. Check your actual payroll frequency before relying on this assumption.
Monthly Status compares the calculated employee contribution rate with the Dashboard target, which is initially 5.0%. A record meeting or exceeding that target is labeled On Track; the label does not determine overall retirement readiness or FERS eligibility.
Yes. The Dashboard includes editable planning assumptions for the FERS pension multiplier, target employee contribution rate, automatic agency contribution, and matching schedule. Verify current official provisions before changing or using those values.
No. It provides a simplified educational estimate based on the entered salary, calculated service credit, and Dashboard multiplier. It does not verify eligibility, high-3 pay, survivor elections, vesting, service history, or other factors used in an official calculation.