Tithe Offering Excel – Free Template (2026)
0
Free download
XLSX workbook for IFRS-style internal reporting with a trial balance, linked financial statements, equity reconciliation, and management dashboard.


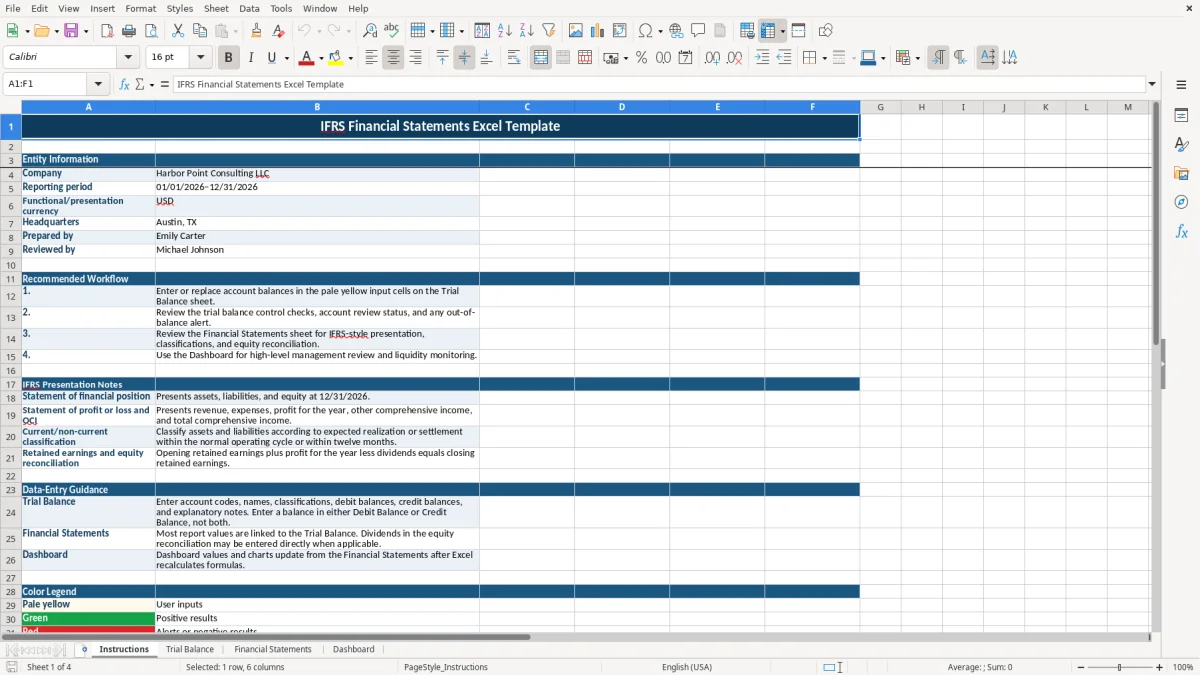
This IFRS financial statements Excel template is an XLSX workbook for U.S.-based businesses that need structured internal reporting for international stakeholders. It contains an Instructions tab, a 100-row Trial Balance input area, linked Financial Statements, and a Dashboard with profitability, asset, and capital-structure charts.
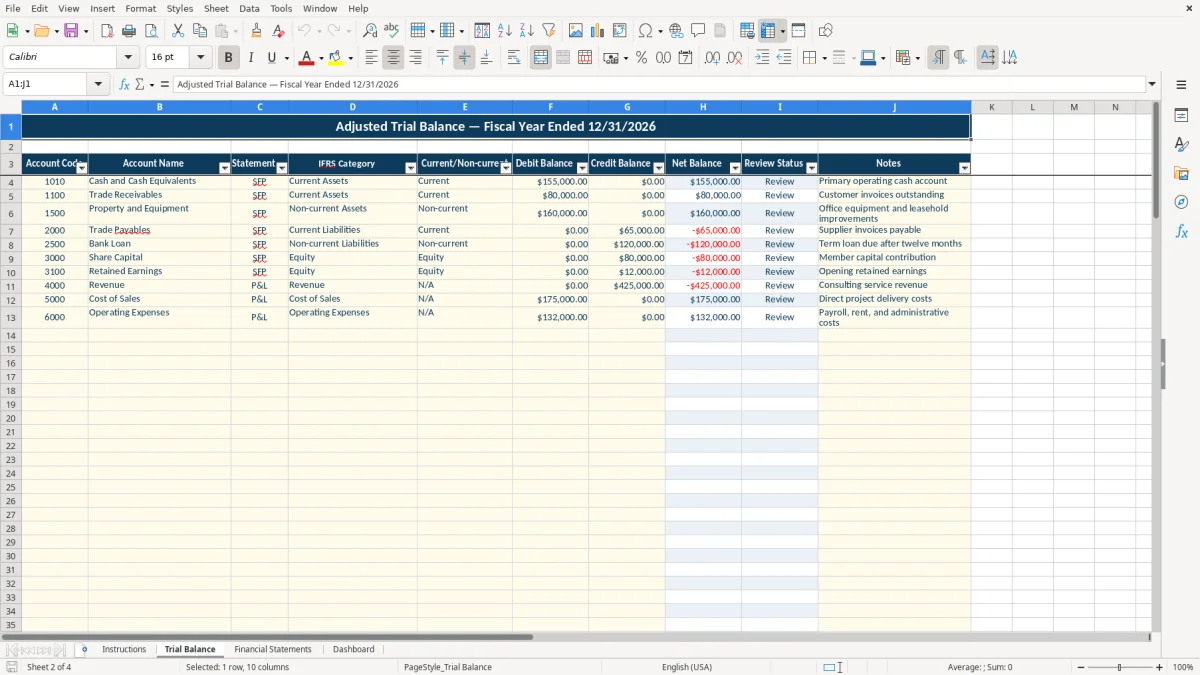
Use the Instructions tab to record the company, reporting period, currency, headquarters, and preparer details. Image 1 shows the workflow notes and color legend; image 2 shows the Trial Balance columns for account codes, classifications, debit and credit balances, net balance, review status, and notes.
The workbook uses sample information for Harbor Point Consulting LLC and the period 01/01/2026–12/31/2026. Replace the sample balances with your own approved figures, then review the linked statements and Dashboard after Excel recalculates the formulas.
A U.S. subsidiary reporting to a foreign parent may need internal statements in an IFRS-style format even when its local books are maintained for U.S. operations. The finance manager, controller, or bookkeeper typically starts with an approved adjusted trial balance at month-end, quarter-end, or the 12/31/2026 year-end close.
This workbook is suited to a consulting LLC, export business, technology subsidiary, or nonprofit with international board reporting needs. It is management reporting, not an audited set of financial statements and not a claim of IFRS compliance.
The Trial Balance provides 100 prepared account rows, with fields for the statement assignment, IFRS Category, and Current/Non-current classification. For example, the sample identifies Cash and Cash Equivalents as a current asset, Property and Equipment as a non-current asset, and Trade Payables as a current liability.
Image 2 shows the pale yellow input area and calculated Net Balance and Review Status columns. A bookkeeper can replace the sample $155,000 cash debit, $80,000 receivables debit, and $65,000 payables credit with approved balances while retaining the classification structure.
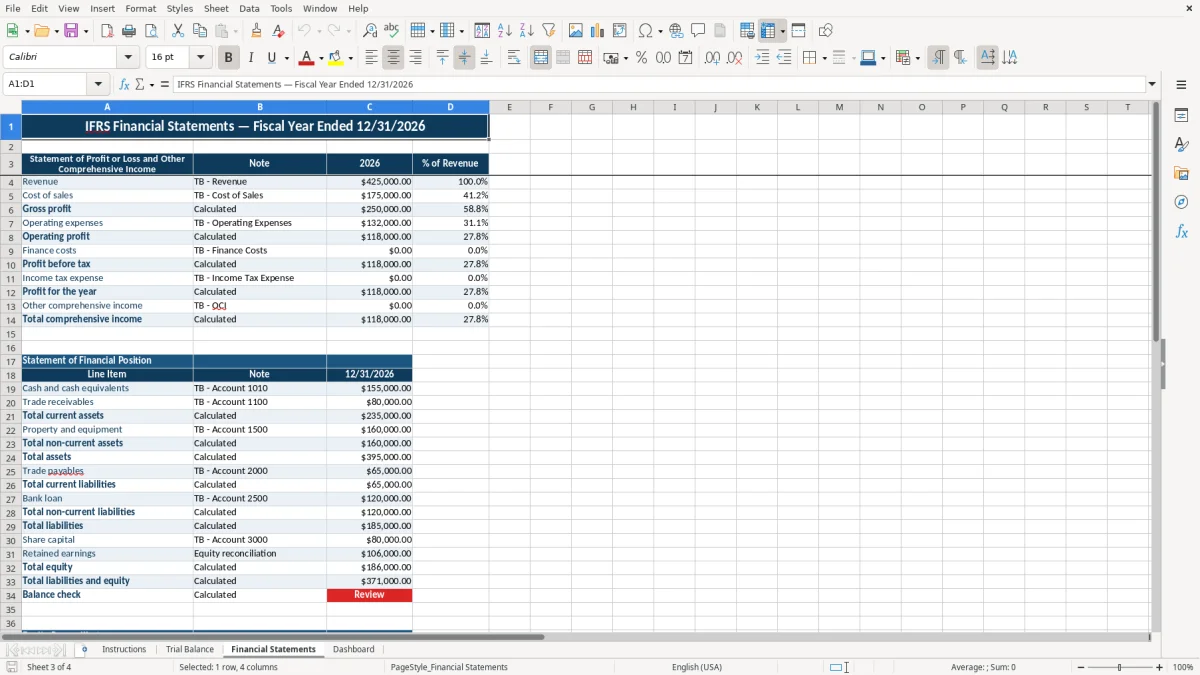
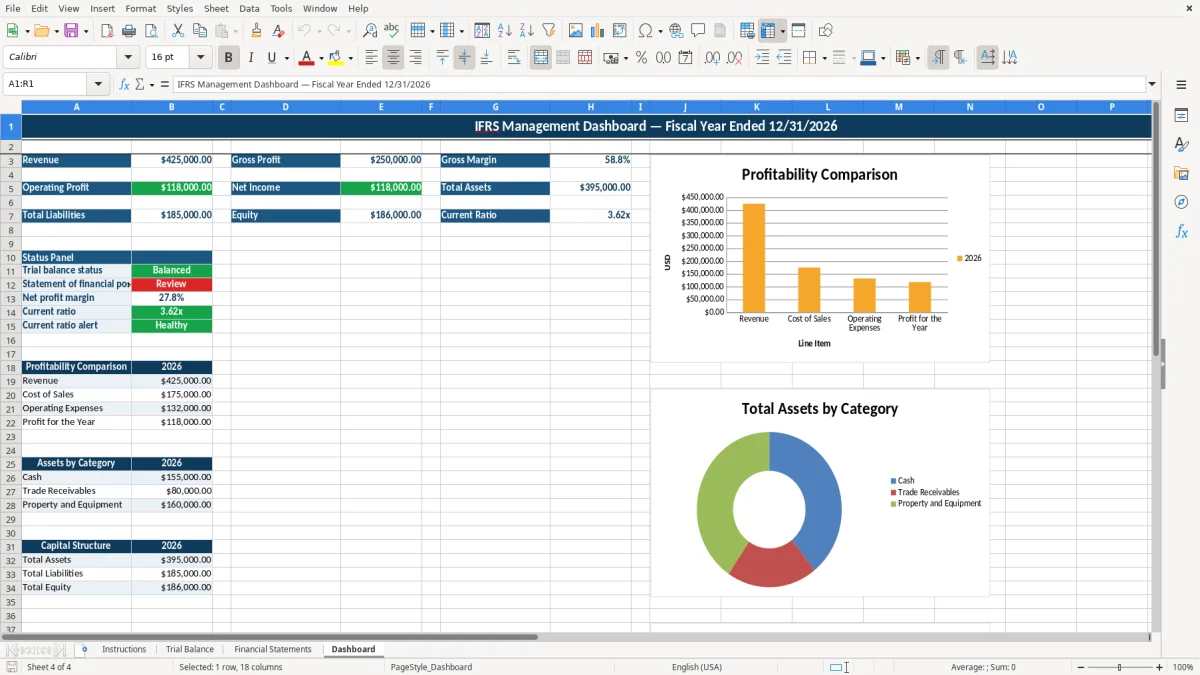
Image 3 shows the linked statement layout: profit or loss and OCI appear above the statement of financial position, with Note references such as TB - Revenue and TB - Account 1010. Image 4 shows the management view used after the accounting close, not as a substitute for source-ledger reconciliation.
The workbook uses IFRS-style labels and classifications for internal reporting. The Instructions tab describes a statement of financial position, current and non-current presentation, a statement of profit or loss and OCI, and a retained earnings reconciliation. Those labels help you organize reporting, but the workbook does not establish statutory compliance or replace an entity’s accounting policies.
On Trial Balance, you assign each row to SFP or P&L and select one of the listed categories: Current Assets, Non-current Assets, Current Liabilities, Non-current Liabilities, Equity, Revenue, Cost of Sales, Operating Expenses, Finance Costs, Income Tax Expense, or OCI. Enter a debit or credit balance, not both. Net Balance calculates debit less credit, and a row is marked OK only when the absolute difference is below $0.01.
The Financial Statements formulas use SUMIF to collect balances by category. Revenue is drawn from credit balances, while cost of sales and expenses are drawn from debit balances. Gross profit, operating profit, profit before tax, profit for the year, OCI, and total comprehensive income are calculated from those linked amounts.
Image 3 shows percentages of revenue beside the 2026 statement amounts. The statement of financial position also calculates totals and equity checks. Use the Dashboard status panel as a second review: it reports Trial Balance status, statement status, net profit margin, current ratio, and a current-ratio alert.
Because the workbook contains no external data feed, audit trail, or statutory filing validation, retain the approved ledger export and reconciliation support separately. Treat the sample 2026 values as illustrations to be replaced, not as current law or required reporting amounts.
The most damaging error is usually classification, not arithmetic. If a $160,000 equipment balance is placed in Current Assets instead of Non-current Assets, total assets may still calculate correctly while liquidity measures and management conclusions become misleading.
The statement formulas collect by category and, for several balance-sheet lines, by account name. A duplicate account named Cash and Cash Equivalents can therefore distort the cash line without producing an obvious formula error. Compare the workbook with the general ledger and investigate unusual totals before distribution.
Another frequent problem is entering the same balance in both Debit Balance and Credit Balance. A $25,000 debit and $25,000 credit on one row create a zero net balance, which can look like a successful check while concealing a bad input. The correct control is one populated balance column per account and a review of the source trial balance.
A row marked Review means the calculated difference is at least $0.01. If 12 rows each contain a $0.01 rounding difference, the individual alerts may appear small, but the accumulated reporting difference is $0.12 before any larger error is found.
Do not distribute a Dashboard showing Review or Review liquidity merely because the charts render. Image 4 is a summary layer: it can show a current ratio below 1.00x, but it cannot explain whether the cause is overdue receivables, excess short-term debt, or a classification mistake. Trace the ratio back to the Financial Statements and then to the Trial Balance.
Use the workbook at a fixed point in the close, preferably after the adjusted trial balance has been approved and before the management reporting meeting. Save a dated copy for each reporting period rather than overwriting the prior file. The sample is set to 01/01/2026–12/31/2026, so update that information when preparing another period.
Do not overwrite formula columns H and I on Trial Balance or linked output cells on Financial Statements and Dashboard. If the Dashboard does not change after an input edit, force Excel to recalculate before interpreting the results; the Instructions tab specifically notes that Dashboard values and charts update after recalculation.
This XLSX workbook is a practical internal-reporting starting point for a defined chart of accounts. Move to a consolidation or accounting system when you need multiple entities, foreign-currency translation, recurring close workflows, transaction-level audit trails, comparative periods, or automated eliminations. Keep this file for a controlled review view rather than stretching it into a consolidation engine.
No. It is an IFRS-style management reporting template for internal use. The workbook includes IFRS-style classifications and presentation, but it does not provide audited statements, statutory compliance, consolidation, or a complete accounting policy assessment.
The workbook contains four tabs: Instructions, Trial Balance, Financial Statements, and Dashboard. The tabs move from entity setup and account input to linked statements and high-level management review.
Enter or replace Account Code, Account Name, Statement, IFRS Category, Current/Non-current, Debit Balance, Credit Balance, and Notes in the prepared rows. Net Balance and Review Status are calculated fields and should not be replaced.
Net Balance is calculated as Debit Balance minus Credit Balance. Review Status displays OK when the absolute value is below $0.01; otherwise it displays Review. Enter a balance in only one of the debit or credit columns for each account.
The Dashboard links revenue, gross profit, operating profit, net income, total assets, total liabilities, equity, gross margin, and current ratio from Financial Statements. It also includes status indicators and three charts for profitability, assets, and capital structure.
Do not treat it as a filing-ready or audited reporting package. The Instructions tab identifies it as a management reporting template and says it should be reviewed by a qualified accountant before statutory reporting, IFRS compliance, tax filings, or financing decisions.