TSP Contribution Allocation Excel – Free Template (2026)
0
Free download
Calculate avalanche payments across 100 debts with a 60-month payoff plan, interest estimates, payoff dates, and Dashboard summaries.


A debt avalanche payoff calculator in Excel ranks your debts by APR, applies required minimums to every active account, and directs available extra money to the highest-rate balance. This workbook contains Debt Inputs, Payoff Plan, Dashboard, and Instructions tabs for up to 100 debts and 60 monthly periods.
Enter your monthly debt budget, plan start date, creditor details, APR, current balance, and minimum payment on the pale-yellow cells in Debt Inputs. The workbook calculates extra payment allocation, monthly interest, total planned payment, avalanche priority, ending balances, cumulative interest, estimated payoff dates, and dashboard summaries.
A debt avalanche spreadsheet is useful when you have several balances, different APRs, and one fixed amount available for repayment each month. A household with two incomes may have a credit card at 29.49%, another card at 24.99%, an auto loan, and a student loan; paying the highest rate first usually reduces interest more efficiently than paying the smallest balance first.
The person using this file may be a household managing bills after a job change, a financial coach preparing a client review, or an office manager helping an owner separate business and personal obligations. It is especially useful on a fixed day each month, before payments are scheduled, because the extra allocation changes as balances decline.
Suppose three accounts total $13,726.45: $2,740.80 at 29.49%, $4,860.25 at 24.99%, and $6,125.40 at 22.99%. With a $2,000 monthly debt budget and $425 in minimum payments, the workbook calculates $1,575 of Extra Payment Available and assigns it to the account with the highest APR.
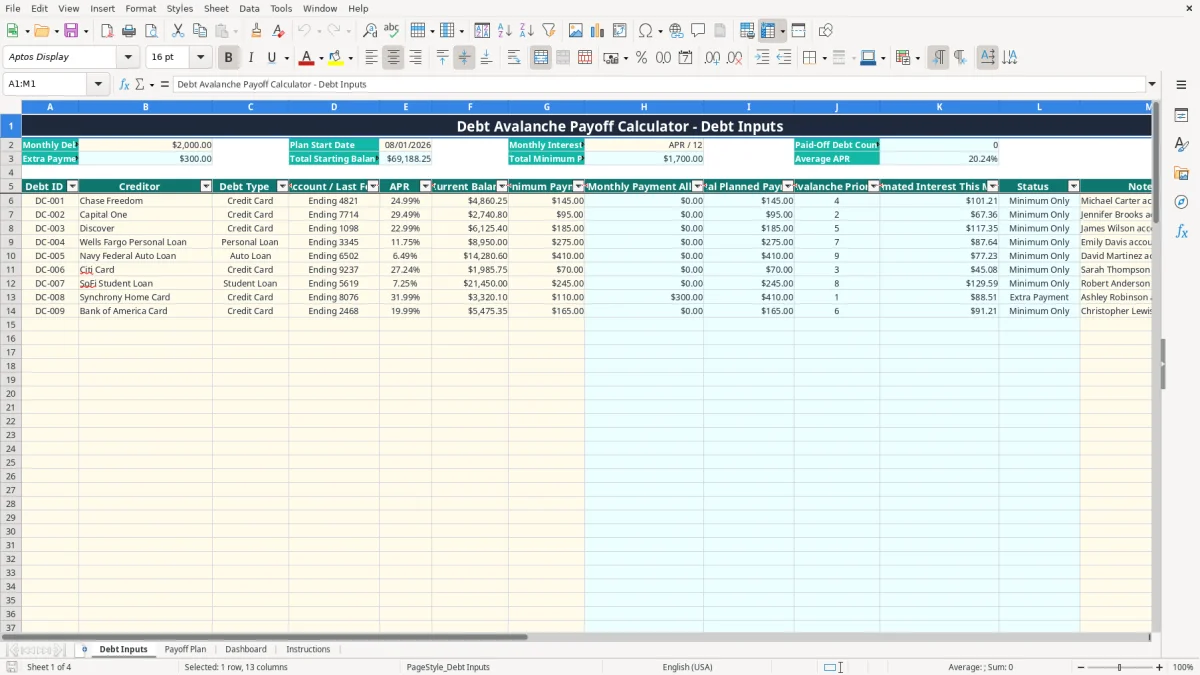
The Debt Inputs tab is where you replace the populated examples with your own records. Image 1 shows the table from Debt ID through Notes, including the calculated Avalanche Priority and Status columns. Keep account references limited to a last four-digit identifier rather than storing full account numbers.
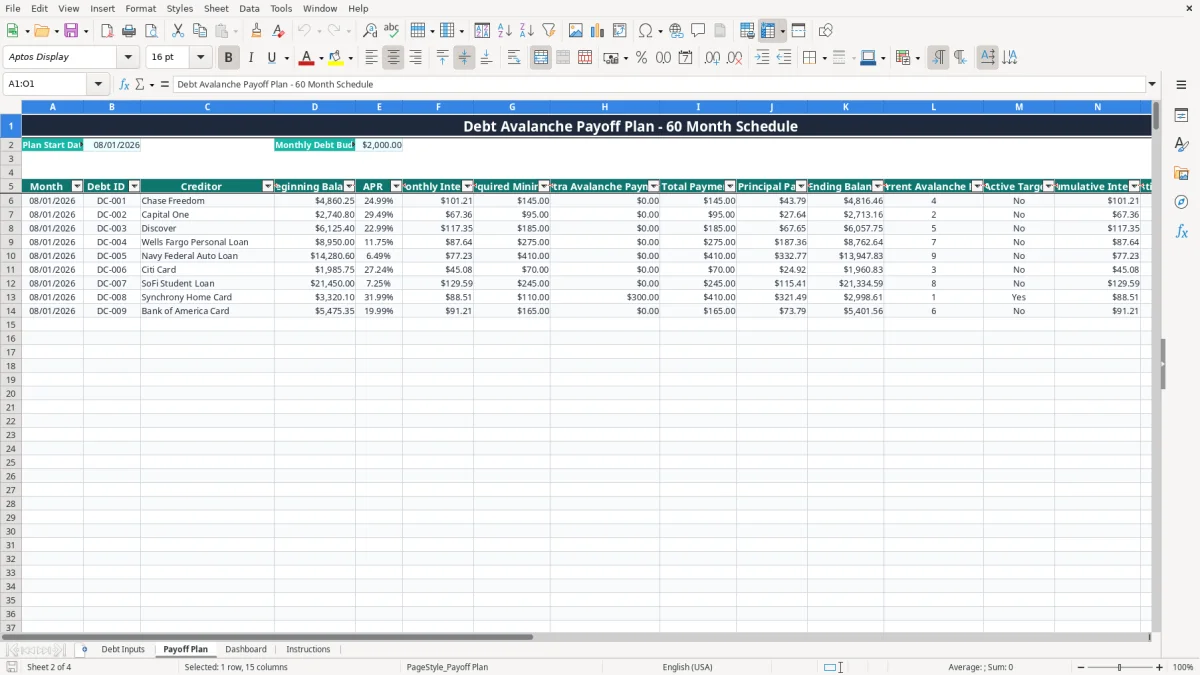
Payoff Plan turns the input list into monthly rows for each debt. Image 2 shows fields for beginning balance, APR, monthly interest, required minimum, extra avalanche payment, total payment, principal paid, and ending balance.
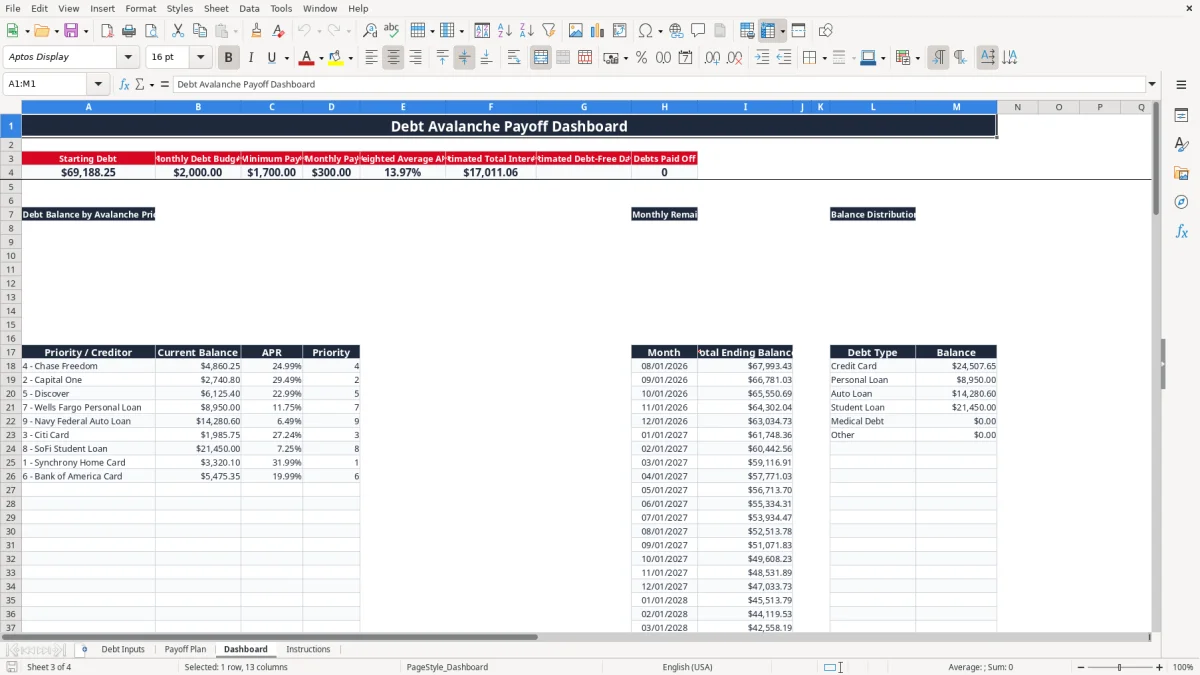
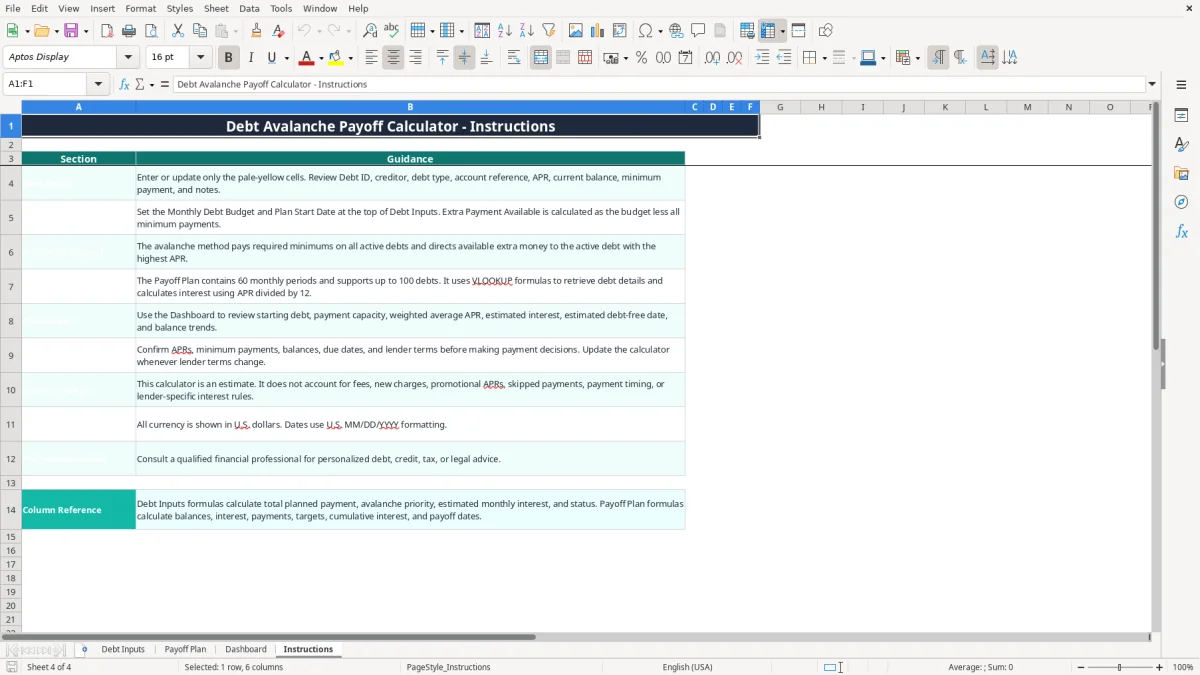
Dashboard is most useful after you have reviewed the input figures. Image 3 shows summary metrics and the three visual areas: Debt Balance by Avalanche Priority, Monthly Remaining Balance Trend, and Balance Distribution by Debt Type. Image 4 shows the written operating guidance in Instructions, including the warning that lender-specific terms can change the estimate.
The workbook uses a straightforward monthly estimate: APR divided by 12. For a $4,000 balance at 24.00% APR, estimated interest for one month is $4,000 × 24.00% ÷ 12, or $80.00. Actual lenders may calculate interest daily, so this figure is a planning estimate rather than a billing statement.
Debt Inputs calculates Total Starting Balance with SUM, Total Minimum Payments with SUM, average APR with AVERAGE, and paid-off count with COUNTIF. Avalanche Priority uses RANK logic on APR, while Extra Monthly Payment Allocation sends the available amount to the debt ranked first.
Enter the APR shown in the lender's current terms, not a guessed rate from an old statement. Check whether the account has a promotional APR, deferred interest, annual fee, balance-transfer fee, or new-charge provision; the workbook does not model fees, new charges, skipped payments, promotional APRs, payment timing, or lender-specific interest rules.
For example, a $15,000 debt budget is not what the file uses; the sample Monthly Debt Budget is $2,000. If minimum payments total $1,250, Extra Payment Available is $750. If minimums exceed the budget, the formula uses zero extra payment rather than inventing money.
Payoff Plan contains prepared formulas through 60 monthly periods, not an unlimited amortization engine. A balance that remains after the final prepared period does not mean the lender will forgive it; it means you need to continue the analysis with updated inputs or a longer planning tool.
Dashboard reports estimated total interest by summing the Payoff Plan's monthly interest rows. It also calculates a weighted average APR based on current balances, which is more informative than simply averaging rates when a $10,000 loan and a $500 credit card are both present.
The most expensive error is entering a wrong APR and then trusting the ranking. If a 29.49% card is typed as 2.949%, it may fall below a 24.99% account; on a $5,000 balance, the correct monthly estimate is about $122.88, while the mistyped rate produces only $12.29. That difference can distort both priority and projected interest.
Minimum payments change when balances fall, fees post, or a lender recalculates its formula. If you leave an old $95 minimum in the sheet after the statement changes to $82, the monthly budget allocation is understated by $13 and the payoff schedule will not match your bank activity.
The workbook caps a scheduled payment at the balance plus estimated interest, which prevents a modeled payment from exceeding the calculated amount due. It does not, however, detect a late fee or a new purchase. A $300 new charge entered nowhere can make the projected ending balance look artificially low.
Users sometimes mark a debt paid in their notes but leave a positive Current Balance. The formulas use the numeric balance and APR, so the schedule continues to treat that account as active. Conversely, entering a zero balance correctly allows the Status formula to show Paid Off, but you still need to confirm the lender's final statement and any residual interest.
Another failure occurs when two debts have the same APR. The ranking formula can assign tied priorities, while the allocation logic is designed around the highest active rank. Choose a consistent operational rule—such as directing the extra amount to the account with the smaller balance—and verify the resulting rows rather than assuming the tie has been resolved.
Finally, a $2,000 monthly budget is a commitment, not a guarantee. If your actual payment is $1,800 for six months, the plan can overstate principal reduction by $1,200 before considering interest. Reconcile the schedule to statements monthly instead of treating the estimated debt-free date as a promise.
Use the workbook on the same date every month, preferably after statements arrive and before automatic payments run. A fixed routine catches changed APRs and minimums early; if three minimum payments increase by $10 each, your available extra payment falls by $30 immediately.
Image 1 is the working entry screen, while Image 2 is the schedule you inspect for the next 60 periods. Image 3 is best for a quick household meeting: the summary shows estimated interest, estimated debt-free date, and debts paid off without making you scan thousands of schedule rows. Image 4 is the reference point when another person takes over the file.
This workbook is a strong fit for a household or small coaching practice with up to 100 debts and a stable monthly budget. It is not a replacement for a lender portal or a full accounting system when payments, fees, and transactions are changing daily.
Move to a dedicated budgeting or financial-planning system when you are maintaining several versions, importing hundreds of transactions each month, or needing automatic bank reconciliation. Keep Excel for scenario planning: for example, compare a $2,000 budget with a $2,300 budget and examine how the estimated debt-free date changes.
It is a repayment model that applies required minimums to active debts and directs available extra money to the debt with the highest APR. This workbook ranks debts by APR, estimates monthly interest as APR divided by 12, and produces a 60-month schedule.
Debt Inputs has prepared rows for up to 100 debts, from rows 6 through 105. Payoff Plan contains 60 monthly periods for those debt records, so review the final schedule period when a balance extends beyond the prepared horizon.
Enter a unique Debt ID, creditor, debt type, account reference or last four digits, APR, current balance, minimum payment, and notes in the input cells. Set Monthly Debt Budget and Plan Start Date at the top; the allocation, priority, interest, total payment, and status columns calculate automatically.
No. It estimates monthly interest with APR divided by 12. It does not account for fees, new charges, promotional APRs, skipped payments, payment timing, or lender-specific interest rules, so compare the results with current statements.
Extra Payment Available is calculated as the budget less total minimum payments and cannot fall below zero. For example, a $2,000 budget with $2,150 of minimum payments produces $0 of extra payment; you should not treat the schedule as evidence that all required payments are affordable.
Dashboard displays Estimated Debt-Free Date using the latest payoff date calculated in Payoff Plan. The schedule also includes Estimated Payoff Date by debt, while Dashboard reports total estimated interest and the number of debts marked Paid Off.