Tithe Offering Excel – Free Template (2026)
0
Free download
Model market-implied growth with editable DCF assumptions, peer comparison, dashboard metrics, charts, and Goal Seek guidance in XLSX format.


A reverse DCF starts with a current share price and works backward to estimate the growth rate implied by that valuation. This XLSX workbook contains an editable five-year model, a single-stage algebraic growth calculation, peer comparison, dashboard metrics, charts, and instructions.
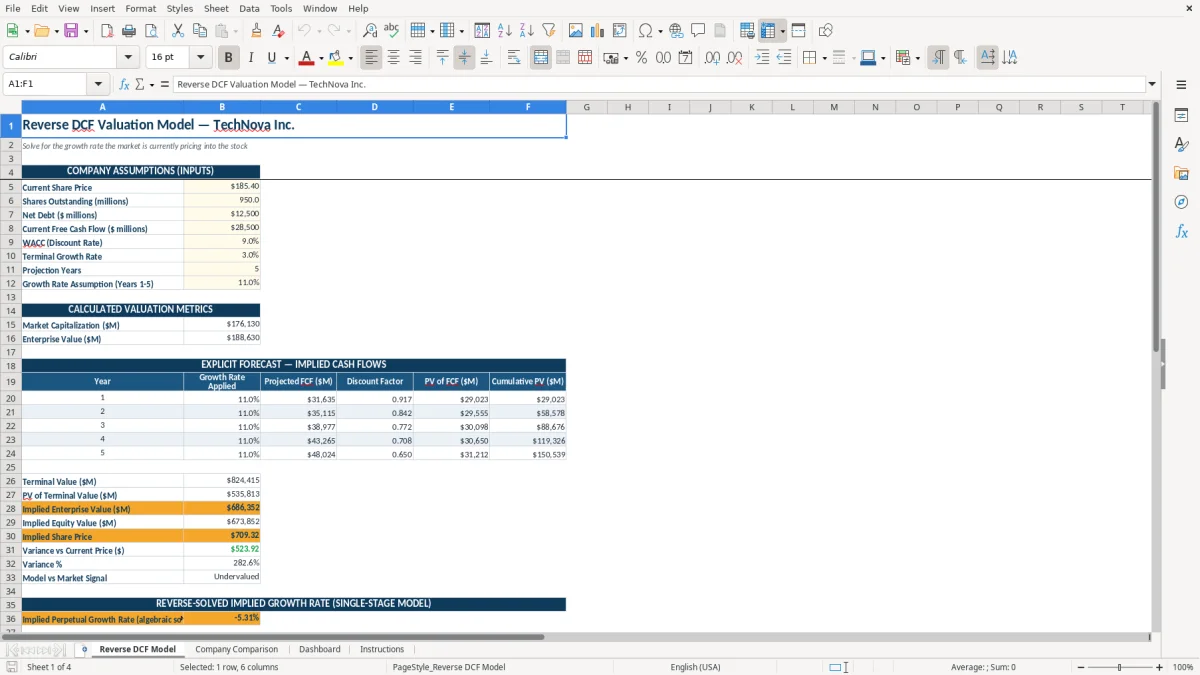
Enter the company assumptions in the Reverse DCF Model tab, including share price, shares outstanding, net debt, free cash flow, WACC, terminal growth, and the forecast growth assumption. The workbook calculates enterprise value, projected FCF, present value, implied share price, variance, and a market signal without making an investment recommendation.
A reverse DCF is useful when you already know the market price and want to ask what operating performance that price requires. An equity analyst can enter a current share price, current FCF, net debt, and WACC, then examine the growth assumption needed to support the valuation instead of starting with a preferred forecast.
For example, the populated TechNova Inc. scenario uses a $185.40 share price, 950 million shares, $12,500 million of net debt, and $28,500 million of current FCF. Those inputs produce a market capitalization from price multiplied by shares and an enterprise value after net debt is added. The model then projects five years of cash flow using the 11% sample growth assumption.
This approach helps a research student, portfolio analyst, or corporate finance team separate price from expectations. If the implied growth rate looks demanding, the next question is whether revenue growth, margins, reinvestment, and free cash flow can plausibly support it. The workbook does not forecast those operating drivers separately; it exposes the growth assumption being tested.
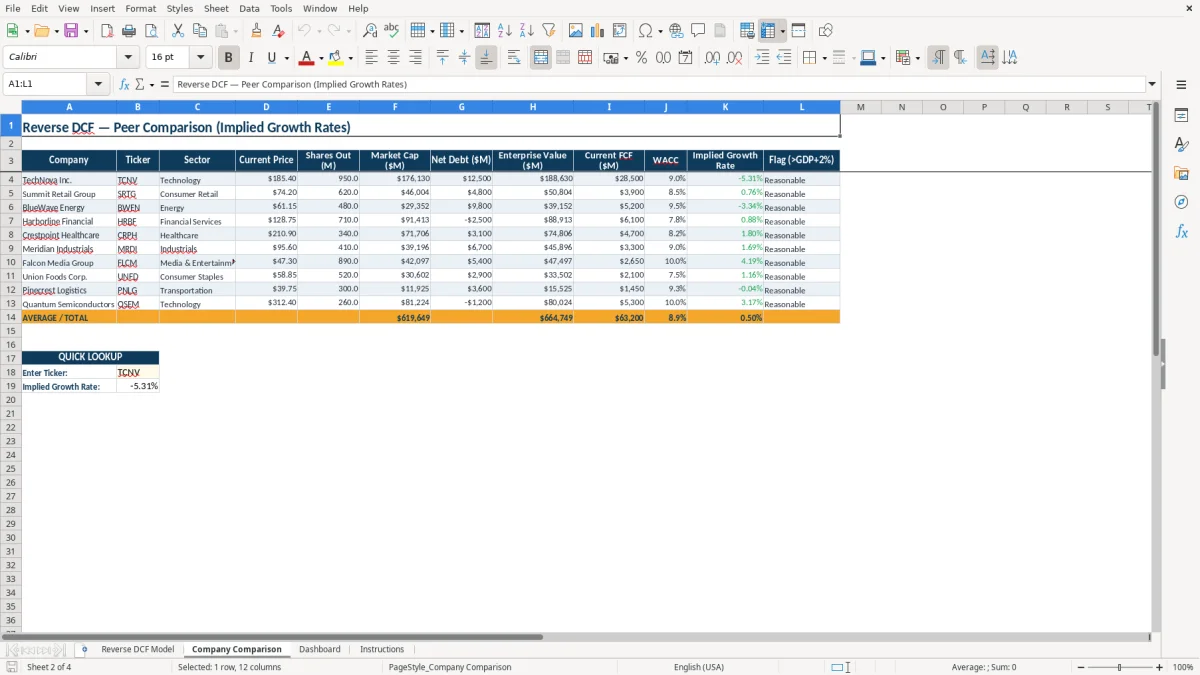
The Company Comparison tab contains 10 populated sample companies across sectors such as technology, retail, energy, financial services, and healthcare. Each row calculates market capitalization, enterprise value, and implied growth rate, while the flag labels rates above 6% as High - Above Trend. Treat those populated names and values as examples to replace with verified research data.
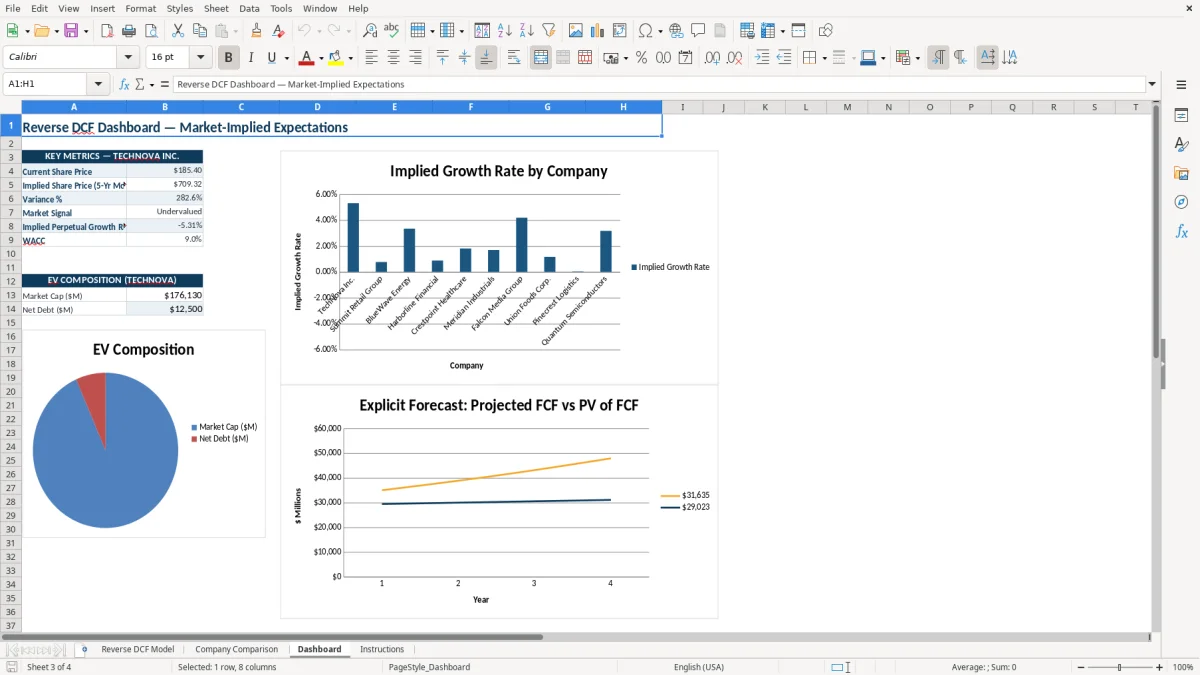
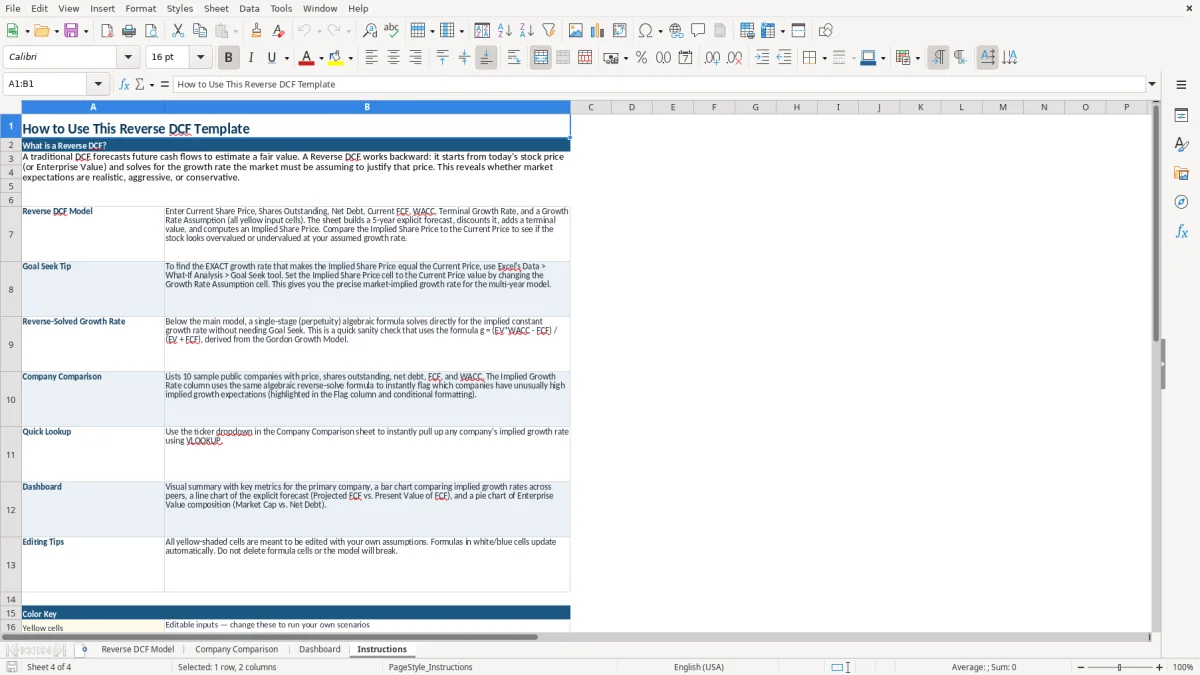
The Dashboard brings the primary model's current price, implied price, variance, market signal, WACC, and value composition together. Image 1 shows the model layout, image 2 shows the peer columns and ticker selection area, image 3 shows the linked metrics and charts, and image 4 contains the operating instructions.
The workbook uses standard discounted cash flow mechanics rather than a tax or regulatory calculation. In the Reverse DCF Model tab, market capitalization is calculated as current share price multiplied by shares outstanding. Enterprise value then adds net debt, so a negative net-debt input reduces enterprise value.
For each of five years, projected FCF grows from the prior year's amount by the growth rate applied. The discount factor follows 1/(1+WACC)^year, and present value equals projected FCF multiplied by that factor. The cumulative PV column adds each year's discounted cash flow, giving you a running view of the explicit forecast contribution.
The sample uses a 9.0% WACC, 3.0% terminal growth rate, five projection years, and 11.0% growth for Years 1-5. These are editable workbook assumptions, not current market guidance or a recommendation. Keep terminal growth below WACC; otherwise the perpetuity relationship becomes mathematically unstable.
The single-stage output uses the algebraic relationship described in the Instructions tab: enterprise value equals FCF multiplied by (1+g) divided by (WACC-g). The five-year model is different because it includes explicit annual cash flows and terminal value, so the workbook directs you to Excel's Data > What-If Analysis > Goal Seek when you want the forecast growth assumption that makes implied share price equal the current price.
Image 1 labels yellow cells as editable inputs and amber cells as key outputs. Do not overwrite formula cells in the white or blue areas. The workbook is provided in XLSX format; practical behavior depends on the spreadsheet application used to open it, especially for Goal Seek and chart rendering.
The most expensive error is treating an implied growth rate as a forecast. It is a valuation back-solve: the output tells you what the entered price and cash-flow assumptions require. If current FCF is unusually high or temporarily depressed, the calculated rate can look precise while describing an abnormal starting point.
Shares outstanding entered in units instead of millions can multiply market capitalization by 1,000,000. Likewise, entering net debt as a positive amount when the company has net cash moves enterprise value in the wrong direction. With a sample price of $185.40 and 950 million shares, a unit error would overwhelm every other assumption.
WACC and terminal growth also deserve a direct check. A 9.0% discount rate and 3.0% terminal growth are not interchangeable percentages, and typing 9 instead of 9.0% makes Excel treat the discount rate as 900%. The perpetuity formula becomes especially sensitive when growth approaches WACC.
The Company Comparison flag marks an implied growth rate above 6% as High - Above Trend. That label is a workbook rule, not an economic conclusion. A peer with a different capital structure, FCF quality, or business cycle can produce a different result even when its headline growth rate appears comparable.
Another common failure is changing a yellow input and then copying over an amber result or formula. The model may continue displaying a number, but its logic is no longer intact. Preserve the formula cells, check that implied enterprise value reconciles to the explicit forecast and terminal value, and use the Dashboard as a review surface rather than as a substitute for source-data verification.
Use the workbook as a structured valuation review, not a one-time calculation. Start with one company, save the original sample separately, and record the source and date for every replacement input. Then run the same checks after each scenario change so you can distinguish a genuine assumption change from an accidental edit.
Make one saved copy per valuation date or scenario and use clear filenames such as Company_BaseCase.xlsx and Company_BearCase.xlsx. The Dashboard is best for presenting the current model state because its eight linked formulas update from Reverse DCF Model, while the Instructions tab explains the intended color coding.
For a small number of companies, this XLSX workflow is practical. Once you are maintaining hundreds of securities, importing recurring financial data, or requiring an audit trail across many analysts, a dedicated financial-data or valuation system is more reliable than manually maintained workbook copies. The file has no live data feed, tables, or automatic data import.
It starts with a current share price and calculates the growth rate implied by the valuation. This workbook also projects five years of FCF, discounts those cash flows, calculates terminal value, and reports implied share price and variance.
You can edit current share price, shares outstanding, net debt, current FCF, WACC, terminal growth rate, projection years, and the Years 1-5 growth rate assumption. Yellow cells are identified as editable inputs in the Instructions tab.
In Excel, open Data > What-If Analysis > Goal Seek. Set the Implied Share Price cell to the Current Share Price value and change the Growth Rate Assumption cell. The Instructions tab provides the same workflow.
It contains 10 populated sample companies with company name, ticker, sector, price, shares outstanding, net debt, current FCF, WACC, implied growth rate, and a flag for rates above 6%. Replace sample values with consistent research data before relying on comparisons.
No. The workbook contains editable sample assumptions, formulas, linked dashboard metrics, and charts, but no live data feed or investment recommendation. Its outputs are numerical scenarios that require your own source-data and valuation review.