HR KPI Excel – Free Template (2026)
5
Free download
Score calls, emails, chats, and in-person interactions with weighted criteria, pass/fail results, agent summaries, and dashboard charts.


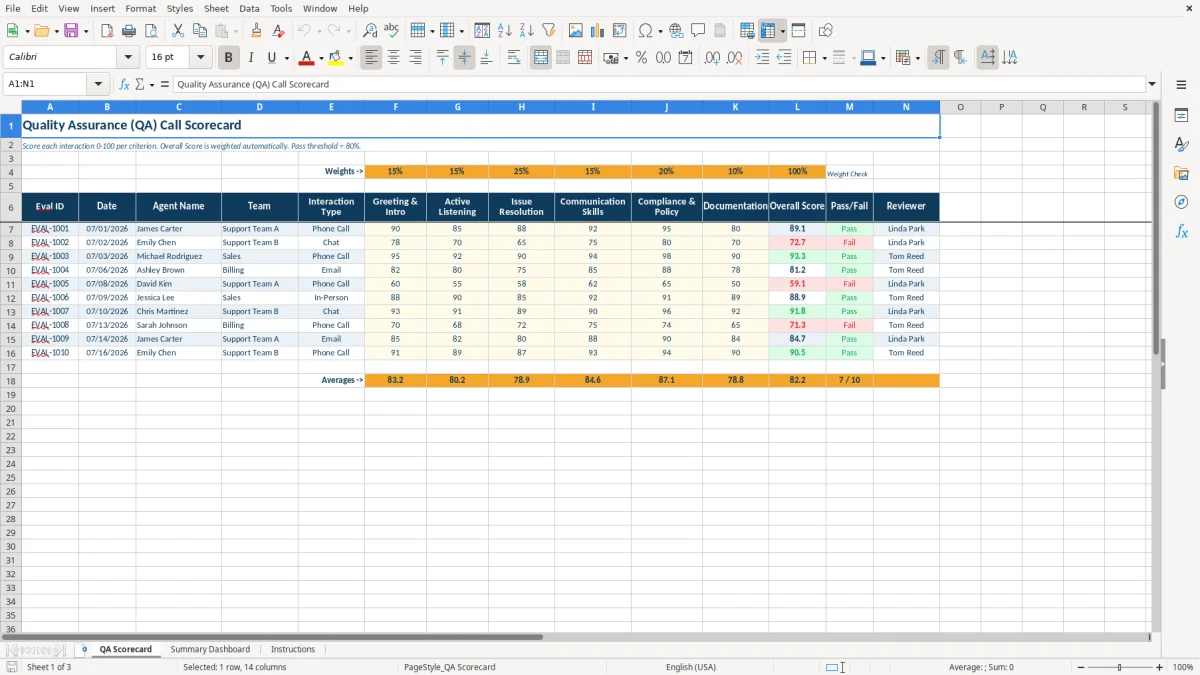
This QA scorecard records customer-interaction evaluations for phone calls, emails, chats, and in-person service. It includes six 0–100 scoring criteria, editable weights, automatic overall scores, an 80-point pass threshold, agent-level summaries, and two dashboard charts.
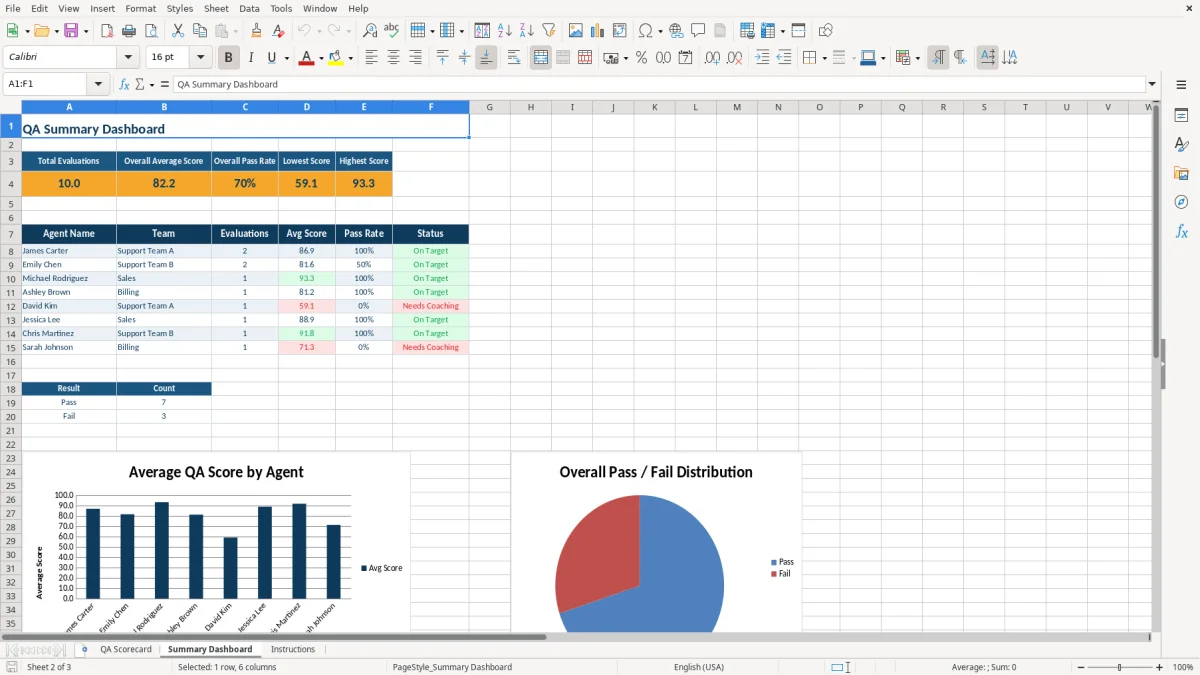
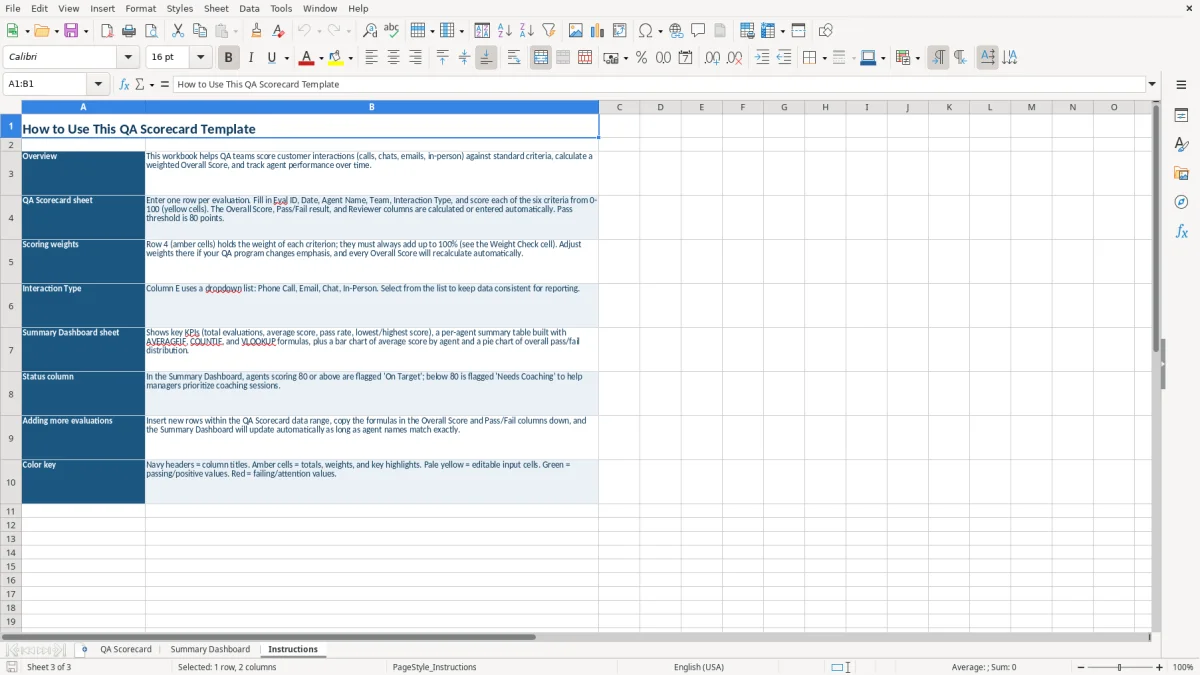
Use the QA Scorecard tab for evaluator input, the Summary Dashboard for performance results, and Instructions for the workbook’s operating notes. Image 1 shows the score entry grid, while image 2 shows the KPI and agent summary layout.
A customer-support manager, quality analyst, or team lead can use this workbook during a weekly review of calls, emails, chats, and in-person interactions. The QA Scorecard tab provides 10 prepared evaluation rows, so you can record the sample date, agent, team, interaction type, reviewer, and six criterion scores in one place.
Each criterion accepts a whole-number score from 0 to 100. For example, the populated rows show EVAL-1001 for James Carter on 07/01/2026 and EVAL-1002 for Emily Chen on 07/02/2026. Those rows demonstrate how a phone call and chat can be evaluated with the same structure.
A supervisor can use the Summary Dashboard after entering the evaluations. It lists agent name, team, evaluation count, average score, pass rate, and status, allowing a manager to distinguish an isolated weak interaction from a repeated performance issue. The dashboard also includes an agent-average chart and a Pass-versus-Fail count chart.
The practical workflow is to score interactions soon after review, then discuss the dashboard during a standing coaching meeting. The workbook is best suited to a defined review group that fits the prepared scorecard range rather than an unrestricted historical database.
The scorecard uses six weighted criteria rather than a simple average. The sample weights are Greeting & Intro 15%, Active Listening 15%, Issue Resolution 25%, Communication Skills 15%, Compliance & Policy 20%, and Documentation 10%. Together they must equal 100%, which the Weight Check cell verifies.
The Overall Score formula multiplies each criterion by its weight and adds the six results. Using the populated EVAL-1001 values, the calculation is 90×15% + 85×15% + 88×25% + 92×15% + 95×20% + 80×10% = 89.55. The result is therefore above the workbook’s 80-point Pass threshold.
The Pass/Fail column uses an IF formula: a score of at least 80 is Pass, and a lower score is Fail. On the dashboard, an agent average of at least 80 is labeled On Target; an average below 80 is labeled Needs Coaching.
Change weights only when your QA policy changes emphasis. If Issue Resolution becomes more important, raise its weight and reduce another weight by the same amount so the Weight Check remains 100%. The workbook contains formulas and sample values, not a mandated industry scoring standard.
The most damaging error is entering criterion values outside the intended 0–100 scale. A score of 8 instead of 80 can reduce an otherwise strong evaluation sharply, while a score of 800 is blocked by the whole-number validation. Review the six yellow input cells before relying on the calculated result.
A second problem occurs when someone changes one weight without balancing the others. If the six weights total 90% or 110%, the weighted score no longer represents the stated scoring model. Check the Weight Check cell after every policy change; the sample model totals 100%.
Blank agent names, inconsistent team names, or manually typed interaction labels can distort the dashboard’s COUNTIF, AVERAGEIF, and VLOOKUP results. Selecting Chat from the dropdown is safer than entering variations such as chat, live chat, or online chat.
Do not overwrite Overall Score, Pass/Fail, or dashboard formula cells with typed results. If a prepared row is extended, copy the formulas in columns L and M down as directed in Instructions. Otherwise, the scorecard may display an input row without a corresponding result, and the dashboard may omit that evaluation.
The easiest way to keep this workbook active is to attach it to an existing quality-review meeting. Enter evaluations immediately after review, then open the Summary Dashboard before the meeting so the total count, average score, pass rate, and agent statuses are ready for discussion.
Use the six criteria to identify the area that needs attention rather than discussing only the overall score. An agent can pass overall while still scoring weakly in Issue Resolution or Documentation, because the weighted result combines all six categories.
The workbook is a practical XLSX scorecard for a prepared evaluation range. Once you need unrestricted historical records, permissions, audit trails, or automated importing from a contact-center platform, move the process into a dedicated QA system. Until then, a fixed weekly review and protected formula cells will keep this spreadsheet manageable.
It measures Greeting & Intro, Active Listening, Issue Resolution, Communication Skills, Compliance & Policy, and Documentation. Each criterion receives a score from 0 to 100, and the workbook calculates a weighted Overall Score.
The workbook treats an Overall Score of 80 or higher as Pass. Scores below 80 are marked Fail, and the dashboard labels agent averages of 80 or higher On Target.
Yes. Edit the weights in row 4 of the QA Scorecard tab, but keep their total at 100%. The Weight Check cell helps confirm that the six weights still add up correctly.
The Interaction Type dropdown includes Phone Call, Email, Chat, and In-Person. Using these fixed choices keeps dashboard reporting consistent.
The dashboard shows total evaluations, overall average score, overall pass rate, lowest score, and highest score. It also summarizes each listed agent and includes charts for average scores and Pass-versus-Fail counts.