Vacancy Tracker Excel – Free Template (2026)
3
Free download
Track employee engagement, absence, performance, turnover risk, headcount, salary bands, and department KPIs in an XLSX workbook.


This HR KPI workbook records employee data and calculates practical workforce measures, including headcount, engagement, absence, performance, promotion rate, tenure, salary band, and turnover risk. It contains an input sheet, an executive dashboard, KPI targets, department summaries, and three charts.
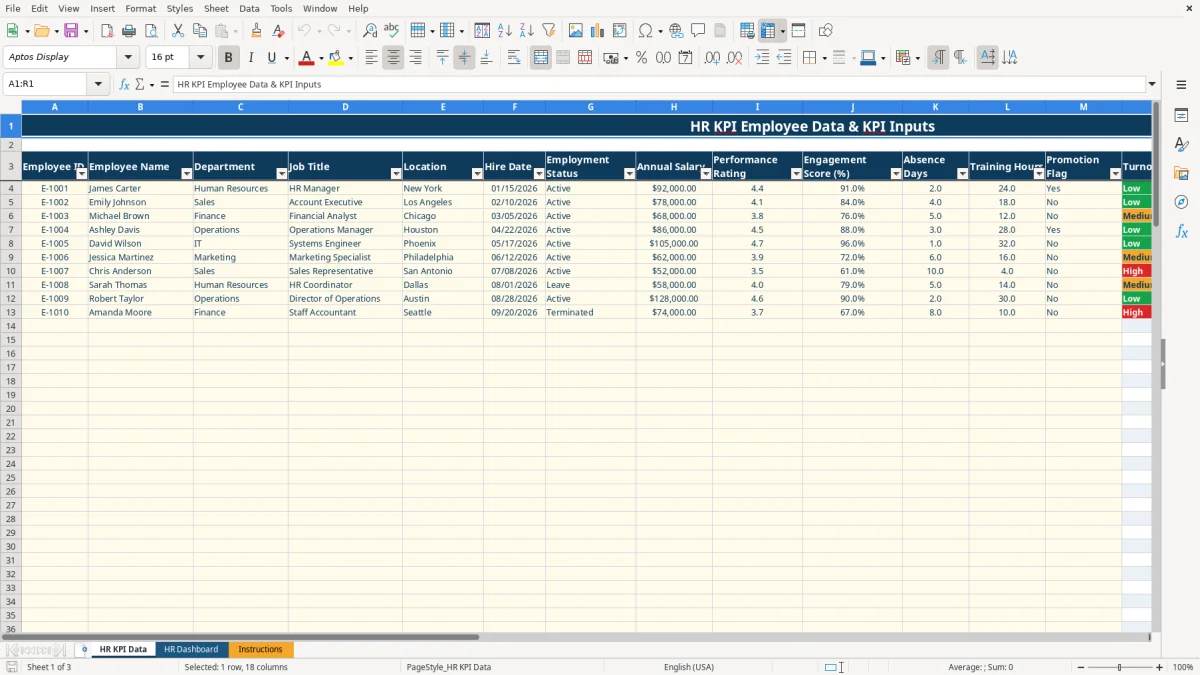
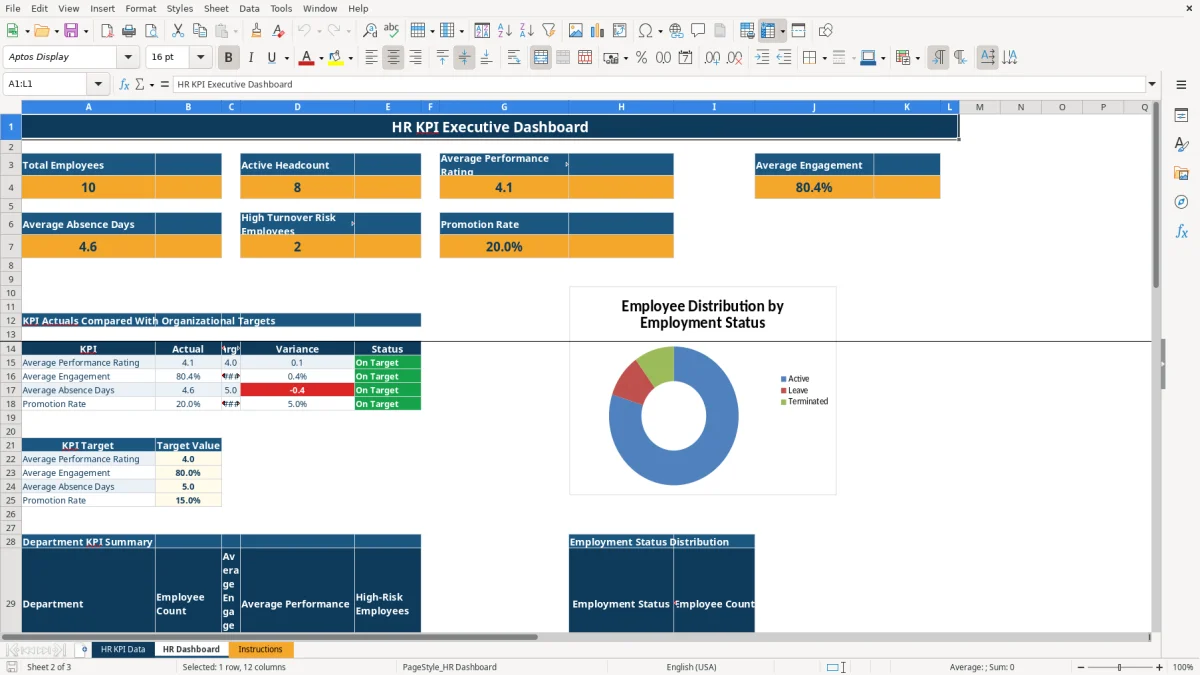
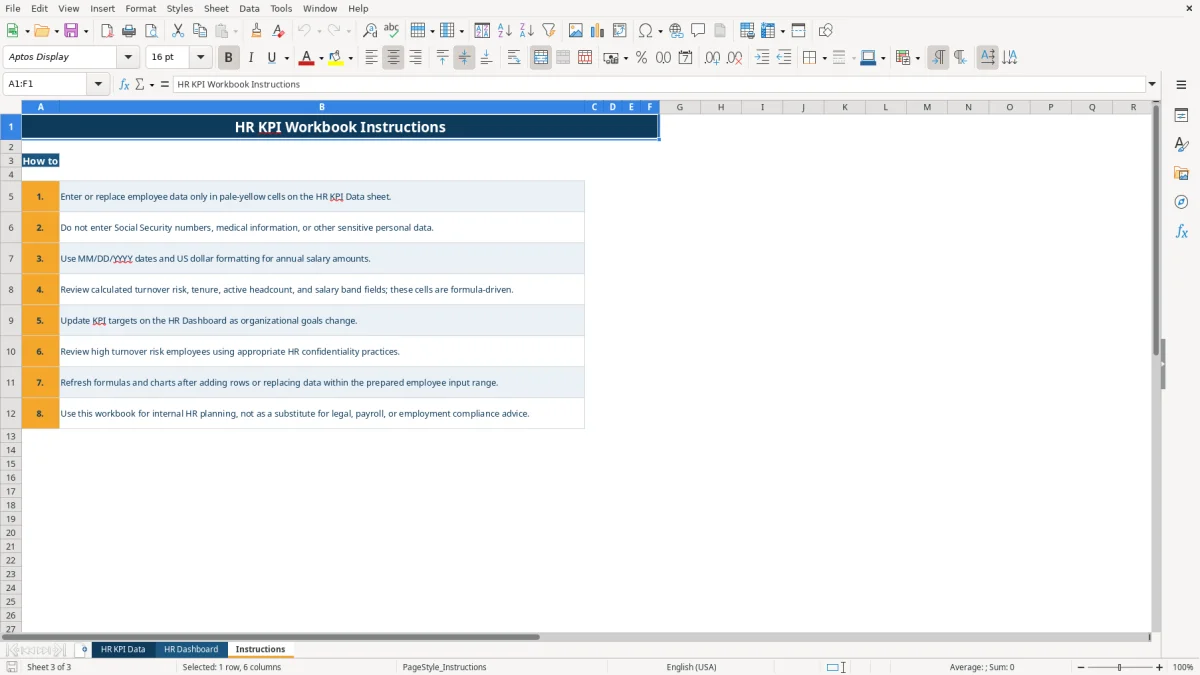
Image 1 shows the HR KPI Data tab with 18 columns, prepared rows 4 through 103, pale-yellow input areas, and formula-driven outputs. Image 2 shows the HR Dashboard with headline metrics, actual-versus-target comparisons, department summaries, employment-status counts, and turnover-risk distributions. Image 3 contains the operating instructions and data-handling reminders.
An HR manager, people-operations lead, or office manager can use this workbook during a monthly workforce review. The HR KPI Data tab has prepared employee rows 4 through 103, so the file is structured for a defined input range rather than an unlimited database. Image 1 shows the working layout: employee identity and job fields appear first, followed by compensation, performance, engagement, absence, training, promotion, calculated indicators, and notes.
Run the dashboard after a payroll or headcount update, before a leadership meeting, and during a quarterly talent review. For example, the sample record for James Carter shows a $92,000 annual salary, a 4.4 performance rating, 91% engagement, 2 absence days, and 24 training hours; those values feed the workbook’s calculated and summarized views.
Use the pale-yellow cells for employee data and treat the calculated columns as outputs. This distinction matters when an HR coordinator replaces sample rows: changing a status to Terminated updates the active-headcount flag, while changing salary can move an employee between the Entry, Mid-Level, and Senior bands.
The workbook uses explicit spreadsheet logic rather than a live HR system. Turnover Risk is High when engagement is below 65% or absence days are at least 8; it is Medium when engagement is below 80% or absence days are at least 5; otherwise it is Low. These are workbook thresholds, not legal or industry standards, so review them before using the result for an employment decision.
The dashboard compares four measures with editable targets: performance rating of 4, engagement of 80%, absence days of 5, and promotion rate of 15%. Its status logic treats lower absence as favorable, while higher performance, engagement, and promotion rates are favorable. A 4.4 rating against a target of 4 produces a favorable positive variance, while 6 absence days against a target of 5 needs attention.
Tenure is rounded to one decimal year using a fixed 10/02/2026 reference date. Active Headcount Flag returns 1 for Active employees and 0 otherwise, allowing the dashboard to sum active workers. Salary Band assigns salaries below $60,000 to Entry, below $90,000 to Mid-Level, and $90,000 or more to Senior.
The most damaging error is entering inconsistent labels. A status typed as Activee will not match the permitted Active value, and a department written differently from the six listed choices can distort the department summary. Use the seven data validations on the input sheet instead of typing alternatives.
Do not overwrite Turnover Risk, Tenure, Active Headcount Flag, or Salary Band. For instance, changing the salary from $78,000 to $92,000 should move the employee from Mid-Level to Senior through the formula; typing over the result hides that relationship and makes later reviews unreliable.
Engagement must be entered as a decimal between 0 and 1, so 84% should be entered as 0.84 when the cell format requires a numeric percentage. Hire dates should use MM/DD/YYYY. A blank hire date leaves tenure blank, while a malformed date can prevent the intended calculation from working.
Privacy mistakes also create avoidable exposure. The Instructions tab specifically prohibits Social Security numbers, medical information, and other sensitive personal data; use employee IDs and business-relevant HR measures instead.
Choose one owner and one review date each month. A practical routine is to update employee records before the leadership meeting, check the four dashboard targets, and record follow-up actions for departments with weak engagement, elevated absence, or high-risk counts. Image 2 gives you one review surface instead of requiring separate calculations.
Do not change target values simply to make a status read On Target. The dashboard’s targets are 4, 80%, 5, and 15%; change them only when your organization has approved new goals, then document the review date outside the workbook or in an approved HR record.
The file is best suited to a controlled internal review of up to the prepared employee range. When you need payroll processing, employee self-service, audit trails, permissions, or a larger historical dataset, move the operational record to an HR information system and retain this XLSX workbook for limited analysis.
The workbook contains HR KPI Data, HR Dashboard, and Instructions. The first sheet holds employee inputs and calculated fields, the second summarizes KPIs and charts, and the third explains entry and review procedures.
You can enter employee ID, name, department, job title, location, hire date, employment status, annual salary, performance rating, engagement score, absence days, training hours, promotion flag, and notes. Turnover Risk, Tenure, Active Headcount Flag, and Salary Band are formula-driven.
The workbook uses engagement score and absence days. High risk means engagement below 65% or at least 8 absence days; Medium uses engagement below 80% or at least 5 absence days when the High condition is not met.
Yes. The HR Dashboard includes target values for performance rating, engagement, absence days, and promotion rate. The sample targets are 4, 80%, 5, and 15%; update them when approved organizational goals change.
The HR KPI Data sheet has prepared rows 4 through 103, with an auto-filter across A3:R103. Follow the Instructions tab after replacing data and refresh formulas and charts within the prepared range.