HR KPI Excel – Free Template (2026)
5
Free download
Track employee review dates, four 1-5 scores, ratings, merit increases, salaries, status, notes, and summary metrics in an XLSX workbook.


This performance review workbook records employee details, review periods, four 1-to-5 evaluation scores, calculated ratings, merit increases, salary changes, review status, and notes. It includes Reviews, Summary, and Instructions tabs so you can enter review data, monitor results, and apply the included rating policy.
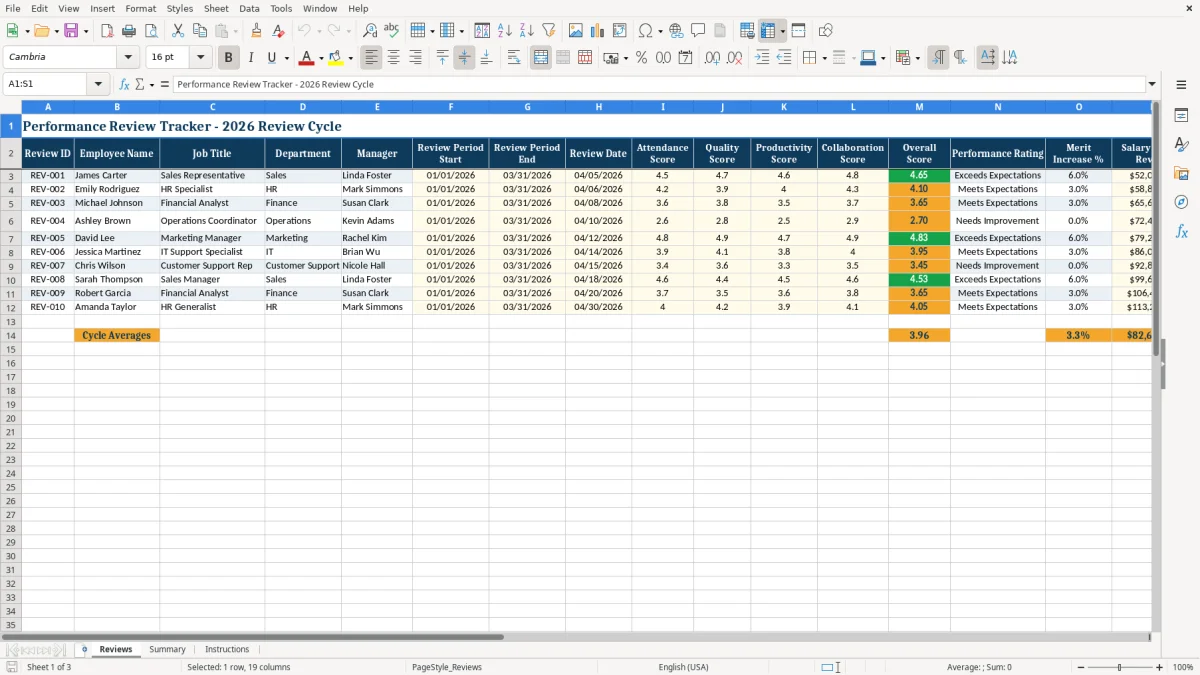
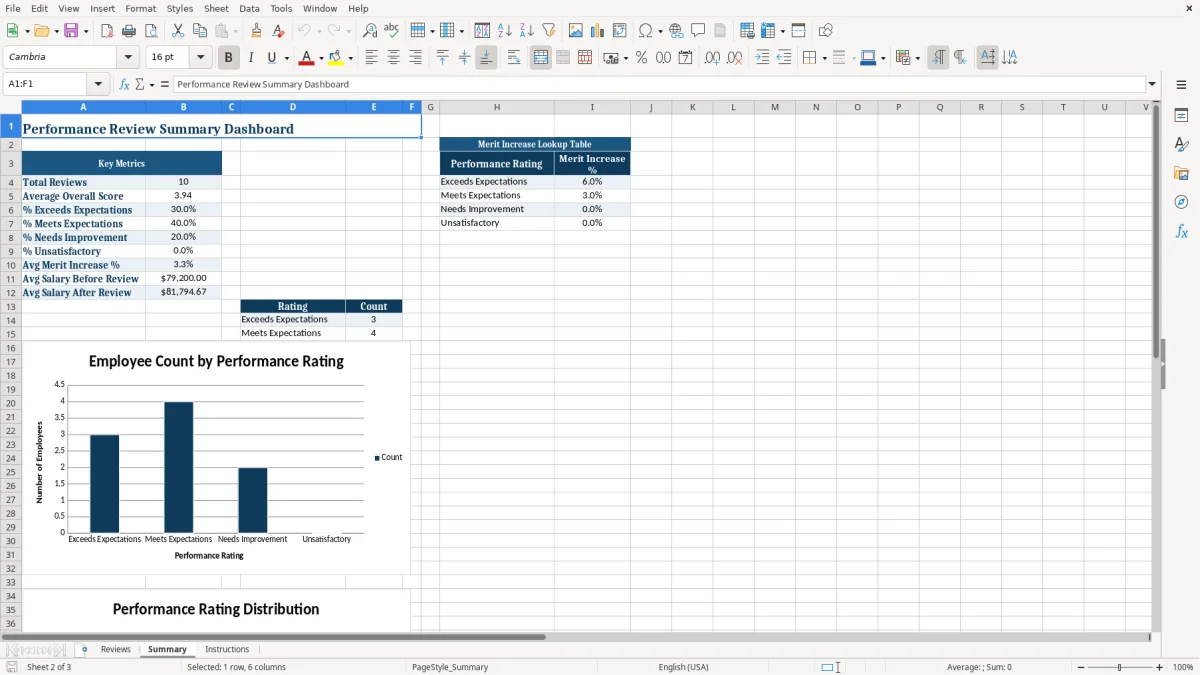
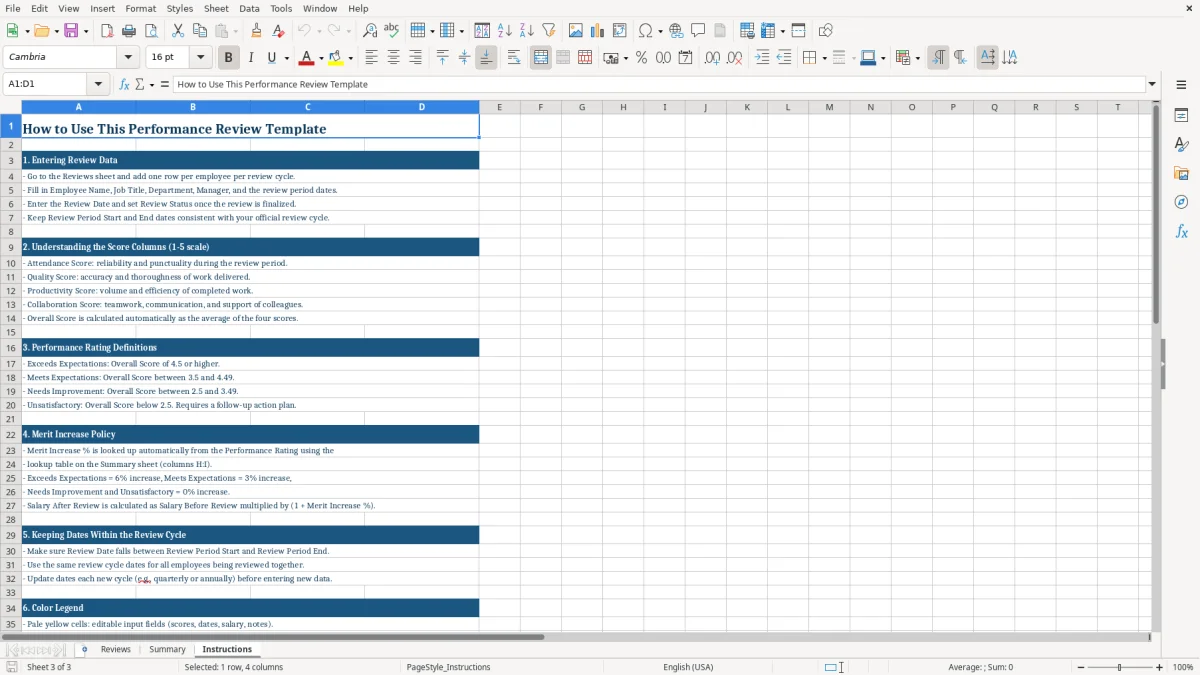
The Reviews tab shown in image 1 contains fields from Review ID through Notes. Image 2 shows the Summary dashboard with key metrics, rating counts, merit-increase percentages, and charts; image 3 explains the scoring, colors, dates, and workflow.
A small-business owner, office manager, or department supervisor can use the Reviews tab during a quarterly or annual review cycle. The sheet keeps the employee record and evaluation in one row: James Carter's sample record includes Sales Representative as the job title, Sales as the department, a 01/01/2026–03/31/2026 review period, and a 04/05/2026 review date.
The four score fields separate attendance, quality, productivity, and collaboration instead of forcing one subjective number. A manager can review a 4.5 attendance score, 4.7 quality score, 4.6 productivity score, and 4.8 collaboration score before the workbook calculates the overall result.
HR can use the employee, manager, department, salary, and notes fields during a compensation review. A company with employees in Sales, HR, and Finance can compare records without creating a separate document for each person, while the Summary tab provides a management-level view of the cycle.
The workbook is especially practical when supervisors complete reviews at different times but use the same review-period dates. Use the Instructions tab to keep the scoring definitions and color meanings consistent across departments.
The workbook uses a 1-to-5 scoring scale. Overall Score is calculated with AVERAGE across Attendance, Quality, Productivity, and Collaboration, so four scores of 4.5, 4.7, 4.6, and 4.8 produce an overall score of 4.65.
The rating formula assigns Exceeds Expectations at 4.5 or higher, Meets Expectations from 3.5 through 4.49, Needs Improvement from 2.5 through 3.49, and Unsatisfactory below 2.5. These thresholds are workbook settings described on the Instructions tab, not an external employment standard.
The Summary tab contains the editable H:I lookup table. Its sample policy assigns 6% to Exceeds Expectations, 3% to Meets Expectations, and 0% to Needs Improvement and Unsatisfactory. For example, the sample $52,000 salary paired with a 6% increase calculates to $55,120 in Salary After Review.
Merit Increase % is returned with VLOOKUP based on the calculated rating, and Salary After Review multiplies Salary Before Review by 1 plus that percentage. Review the policy table before using the results for a compensation decision.
The most damaging error is changing the scoring scale halfway through a cycle. If one manager treats 5 as exceptional and another treats 5 as merely strong, the Summary percentages no longer compare like with like; keep the four category definitions from the Instructions tab visible during each review.
Typing over Overall Score, Performance Rating, Merit Increase %, Salary After Review, or Review Status removes the calculated result for that row. The editable fields are the employee details, dates, four scores, salary before review, and notes. A missing score can also distort the AVERAGE result and produce a rating that does not reflect the manager's full assessment.
The included 6% and 3% values are sample policy inputs. Applying them without checking the Summary lookup table can turn a $58,800 salary into an unintended $60,564 result, while a zero-percent rating may be mistaken for a payroll instruction rather than a review-policy illustration.
Another problem is treating Review Status as proof that a meeting occurred. The formula marks Unsatisfactory records Follow-up Required and other ratings Complete; managers should still confirm the discussion and any action plan outside the calculated label.
Make one person responsible for maintaining the Reviews tab and set a fixed review-cycle checkpoint. Before managers begin, copy the prior XLSX file, update the Review Period Start and End dates, and confirm that Review Date entries fall within the intended cycle.
Keep formula columns separate from input columns and avoid inserting text into score cells. The Summary tab's rating policy is the right place to change the included percentages; changing individual Salary After Review values defeats the workbook's calculation trail.
Use the Instructions tab's color legend during training: pale yellow identifies input areas, navy identifies headers, green marks strong performance, and red indicates unsatisfactory or follow-up attention. When review records exceed the prepared workbook area or you need permissions, audit history, or payroll integration, move to an HR system rather than relying on manual spreadsheet control.
Overall Score is the average of Attendance Score, Quality Score, Productivity Score, and Collaboration Score. The workbook calculates it with AVERAGE rather than requiring a separate manual entry.
A score of 4.5 or higher is Exceeds Expectations, 3.5 through 4.49 is Meets Expectations, 2.5 through 3.49 is Needs Improvement, and below 2.5 is Unsatisfactory.
Yes. Edit the percentage values in the Summary tab's H:I lookup table. The included illustrations are 6% for Exceeds Expectations, 3% for Meets Expectations, and 0% for the remaining ratings.
The Reviews formula assigns Follow-up Required when Performance Rating is Unsatisfactory. It flags the record for attention; it does not create a separate action plan or employee document.
Managers should complete employee details, review-period dates, Review Date, the four 1-to-5 scores, Salary Before Review, and Notes. Overall Score, Performance Rating, Merit Increase %, Salary After Review, and Review Status are calculated fields.