HR KPI Excel – Free Template (2026)
5
Free download
Track employee KPIs, targets, actuals, weighted scores, ratings, and review notes with an Excel workbook for managers and HR teams.


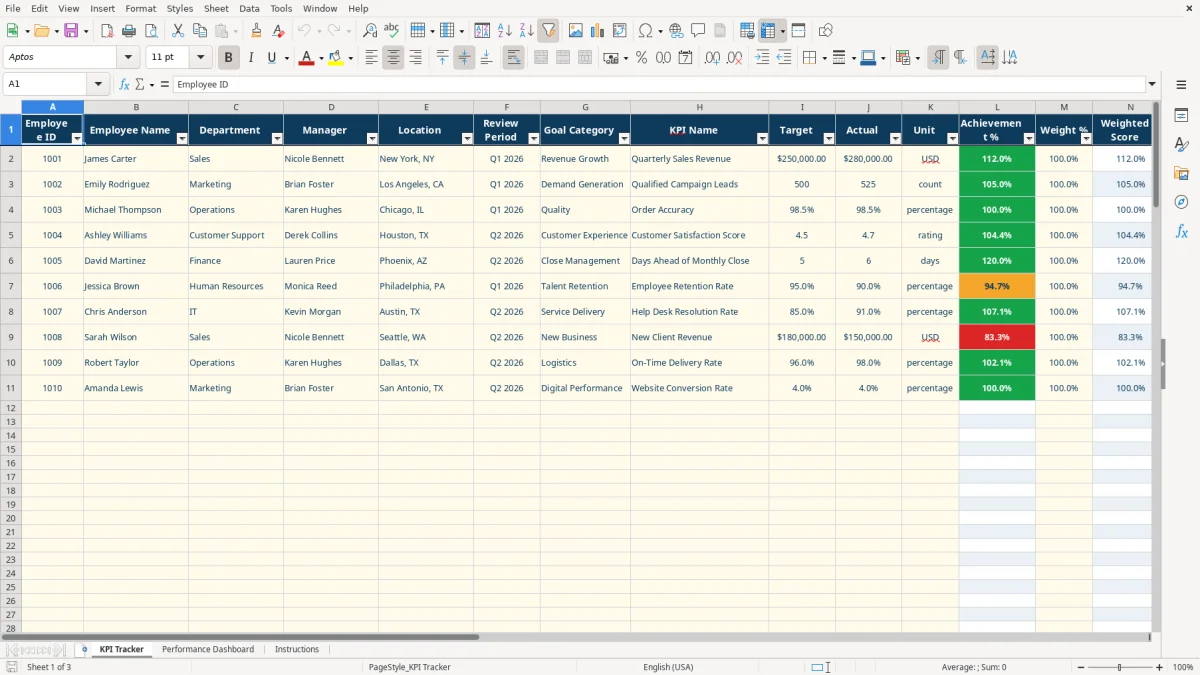
This employee performance KPI Excel template records each employee's targets, actual results, achievement percentage, weight, weighted score, status, manager rating, review date, and notes. It is used for quarterly performance reviews and ongoing manager reporting.
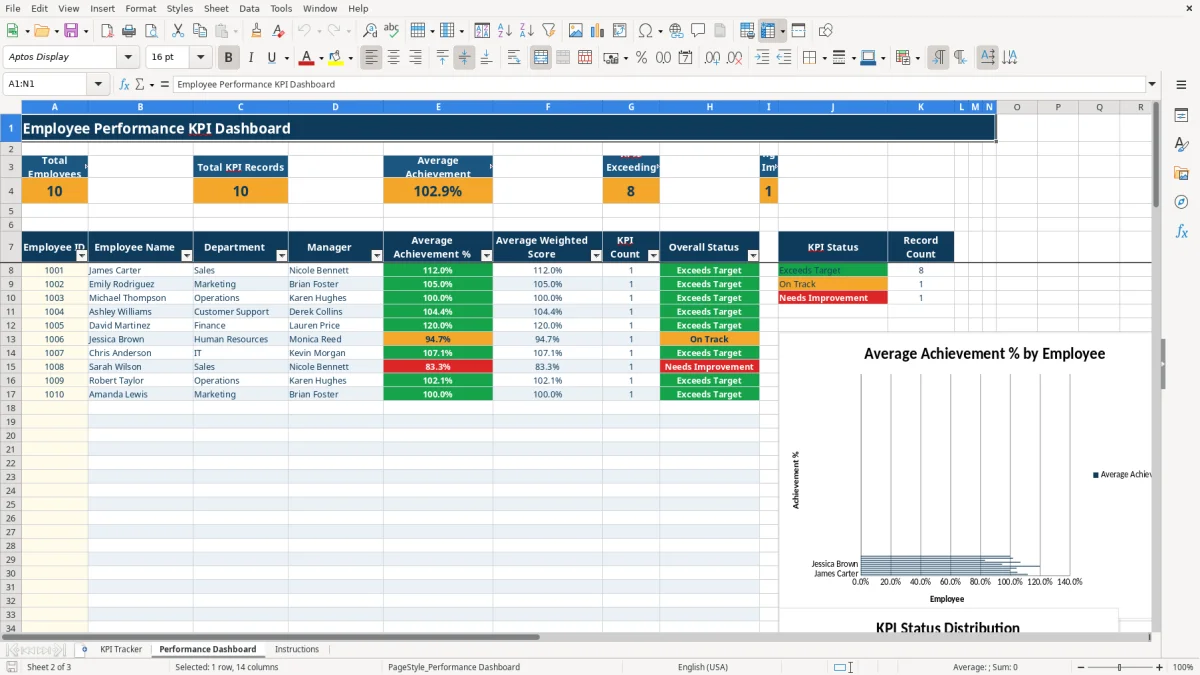
The workbook includes a KPI Tracker for data entry, a formula-driven Performance Dashboard for employee summaries, and an Instructions tab. The tracker has 100 prepared rows, while the dashboard summarizes employee IDs entered in its yellow input column.
An employee performance KPI spreadsheet suits an office manager, department leader, HR coordinator, or small-business owner who needs one consistent record for quarterly reviews. A sales manager can record revenue, a marketing manager can track qualified leads, and an operations manager can measure order accuracy or cycle time without placing every review in a separate document.
The workbook's Review Period list includes Q1 2026 through Q4 2026. You can enter one row for each employee KPI and preserve prior quarters in the same KPI Tracker, so a year-end discussion can compare results rather than rely on memory.
For example, the populated sample includes a $250,000 target and $280,000 actual for quarterly sales revenue. The calculated Achievement % is 112%, which produces an Exceeds Target status. A marketing record with a target of 500 qualified leads and an actual of 525 follows the same structure even though its unit is count rather than USD.
The tracker includes Department, Manager, Location, Goal Category, and KPI Name fields. Its department validation list includes Sales, Marketing, Operations, Customer Support, Finance, Human Resources, and IT, making the sheet practical for a mixed department review cycle.
Use the dashboard when leadership needs an employee-level view. Enter an employee ID in the dashboard's prepared rows, and formulas return the employee name, department, manager, average achievement, average weighted score, KPI count, and overall status from KPI Tracker.
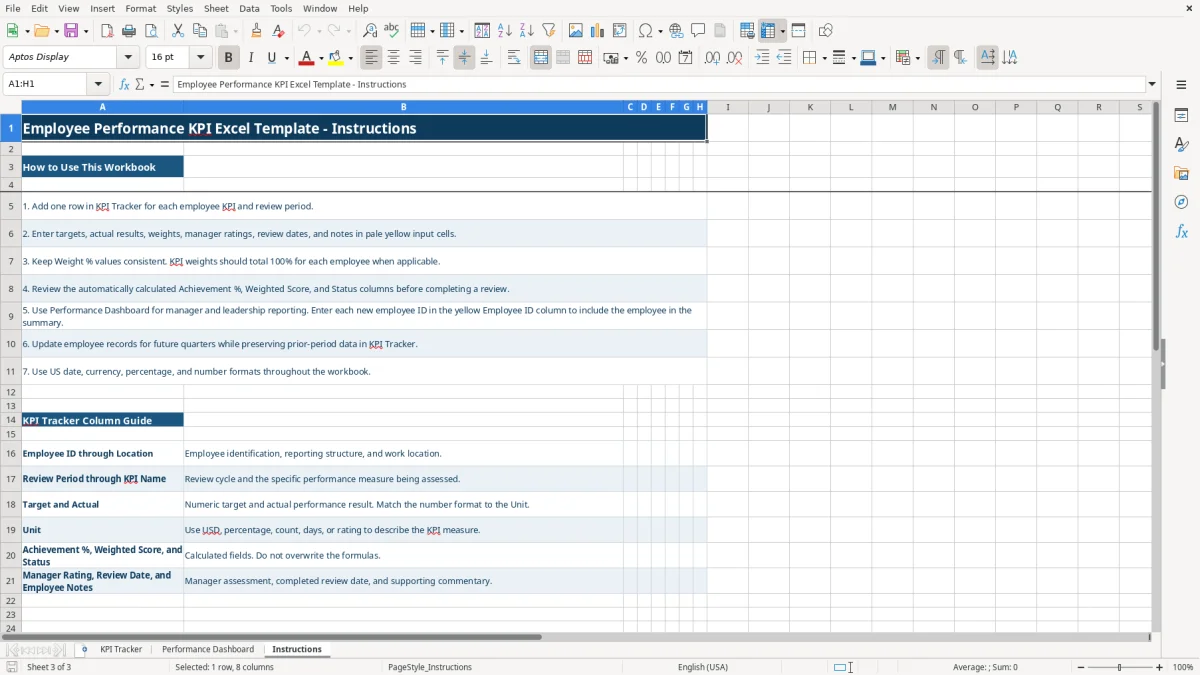
The workbook separates entered performance data from calculated outputs. In KPI Tracker, Target is the planned result, Actual is the measured result, Weight % expresses the KPI's importance, and Unit identifies whether the measure is USD, percentage, count, days, or rating.
Achievement % is calculated as Actual divided by Target. A $280,000 result against a $250,000 target equals 1.12, displayed as 112.0%. Weighted Score then multiplies that achievement by Weight %. With a 100% weight, the weighted score is also 112.0%.
The formulas classify results using fixed workbook thresholds: Achievement % of 100% or more is Exceeds Target, 90% through less than 100% is On Track, and below 90% is Needs Improvement. These are workbook classifications, not a legal or compensation standard.
Department, Review Period, and Unit use dropdown lists. Weight % accepts decimal values from 0 to 1, Manager Rating accepts values from 1 to 5, and Review Date uses a date validation. The dashboard uses VLOOKUP to return employee details, AVERAGEIF to summarize achievement and weighted score, and COUNTIF to count KPI records and statuses.
Keep each KPI's Target and Actual in comparable units. Do not enter $250,000 as the target and 280 as the actual, and do not replace calculated columns L, N, or O with typed values.
Performance tracking becomes unreliable when managers mix units, duplicate employee IDs, or enter results without a defined review period. The workbook can calculate a percentage from the numbers supplied, but it cannot determine whether a KPI is well designed or whether the Actual value came from a reliable business report.
A target of 500 leads and an actual of 525 produces 105% achievement. If a manager enters 5.25 instead of 525, the same record shows 1.05% and may be labeled Needs Improvement. Select the correct Unit and check the displayed number format before saving a review.
If three KPIs have weights of 50%, 30%, and 10%, the total is 90%, not 100%. The weighted score may still calculate, but the employee's combined result does not represent a complete weighting plan. The Instructions tab specifically recommends consistent weights totaling 100% for each employee when applicable.
The dashboard depends on the Employee ID entered in its summary rows. If the tracker contains ID 1002 but the dashboard row contains 1022, VLOOKUP cannot return the employee's details. Before a review meeting, compare the dashboard IDs with KPI Tracker and confirm that blank rows are not being mistaken for zero performance.
Use the KPI Tracker during a fixed review routine instead of waiting until the end of a quarter. A practical schedule is to update Actual results monthly, confirm notes after the manager conversation, and complete the Review Date when the assessment is finished.
Use the same Employee ID for every KPI belonging to one employee and keep the Review Period aligned across related records. For example, three Q2 2026 KPIs for one employee should share the same ID and period while retaining distinct KPI names and weights.
Start with the Instructions tab, then filter KPI Tracker using its auto-filter to inspect a department, manager, or review period. On the dashboard, verify the total KPI records and status counts against the tracker before presenting results.
This XLSX workbook is best suited to a controlled team workbook with prepared rows and formula summaries. If your process requires permissions, audit history, employee self-service, or a larger multi-user database, move the workflow to a dedicated HR performance system rather than relying on copied spreadsheet files.
It tracks Employee ID, employee name, department, manager, location, review period, goal category, KPI name, target, actual, unit, achievement percentage, weight, weighted score, status, manager rating, review date, and employee notes.
Achievement % is calculated by dividing Actual by Target. For example, $280,000 divided by a $250,000 target equals 112.0%. The formula returns a blank when the employee ID or target is blank.
The workbook labels achievement of 100% or more as Exceeds Target, achievement from 90% to less than 100% as On Track, and achievement below 90% as Needs Improvement.
Enter the employee's ID in an available row of the dashboard's Employee ID column. The formulas use that ID to return the employee name, department, manager, average achievement, average weighted score, KPI count, and overall status.
Yes. The Unit dropdown includes USD, percentage, count, days, and rating. Enter Target and Actual using matching values and select the unit that describes the measure.