HACCP Excel – Free Template (2026)
5
Free download
Track assets, service intervals, due dates, technicians, costs, and maintenance status with a preventive maintenance workbook for U.S. operations teams.


A preventive maintenance Excel template organizes equipment records, service intervals, last-service dates, next due dates, assigned technicians, and service costs. This workbook includes a PM Schedule tab for asset-level tracking, a Dashboard tab for status and cost summaries, and an Instructions tab explaining the workflow.
Use the sample records as a starting point or replace them with your own equipment. The PM Schedule calculates Next Due Date, Days Until Due, and Status from your entries, while the Dashboard summarizes overdue work, items due within 7 days, maintenance costs, categories, and monthly due counts for 2026.
A facilities coordinator can use this workbook for air handlers, compressors, and other building equipment. A warehouse manager can track forklifts, while an operations supervisor can maintain records for production assets across several departments and locations.
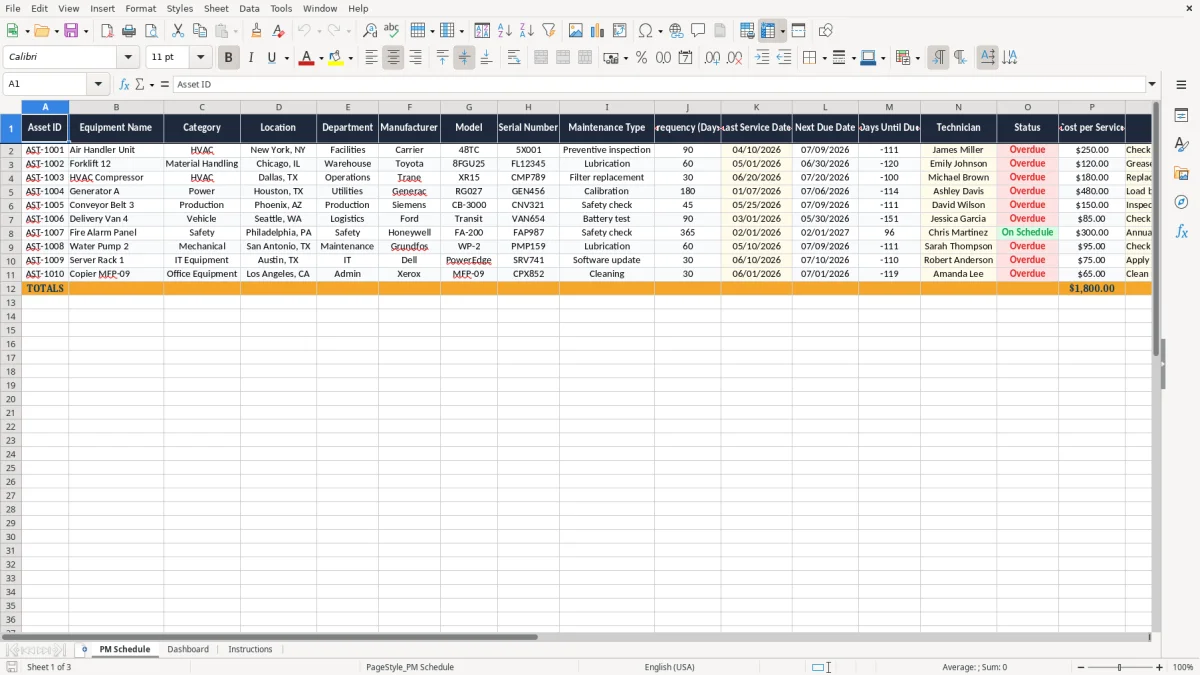
Image 1 shows the PM Schedule tab with columns for Asset ID, Equipment Name, Category, Location, Department, Manufacturer, Model, Serial Number, Maintenance Type, Frequency (Days), Last Service Date, Next Due Date, Days Until Due, Technician, Status, Cost per Service, and Notes. That layout keeps the identity of an asset beside the information needed to schedule its next visit.
The workbook is designed for a recurring review rather than a one-time list. For example, the sample Air Handler Unit has a 90-day frequency and a $250.00 cost per service, while Forklift 12 has a 60-day frequency and a $120.00 cost. Those populated rows illustrate the calculations; you should replace them with your actual equipment and service history.
A four-person maintenance team can review the Dashboard before assigning technicians, then work from the PM Schedule for asset-level details. The Department and Location fields also help when one technician covers facilities in New York, warehouse equipment in Chicago, and operations equipment in Dallas.
The PM Schedule uses a straightforward date calculation: Next Due Date equals Last Service Date plus Frequency (Days). Days Until Due then subtracts today's date from the calculated due date, so the schedule changes as the calendar moves forward.
Status follows three labels. A negative Days Until Due value produces Overdue; a value from 0 through 7 produces Due Soon; a value above 7 produces On Schedule. The Dashboard counts these labels with COUNTIF and calculates total cost with SUM.
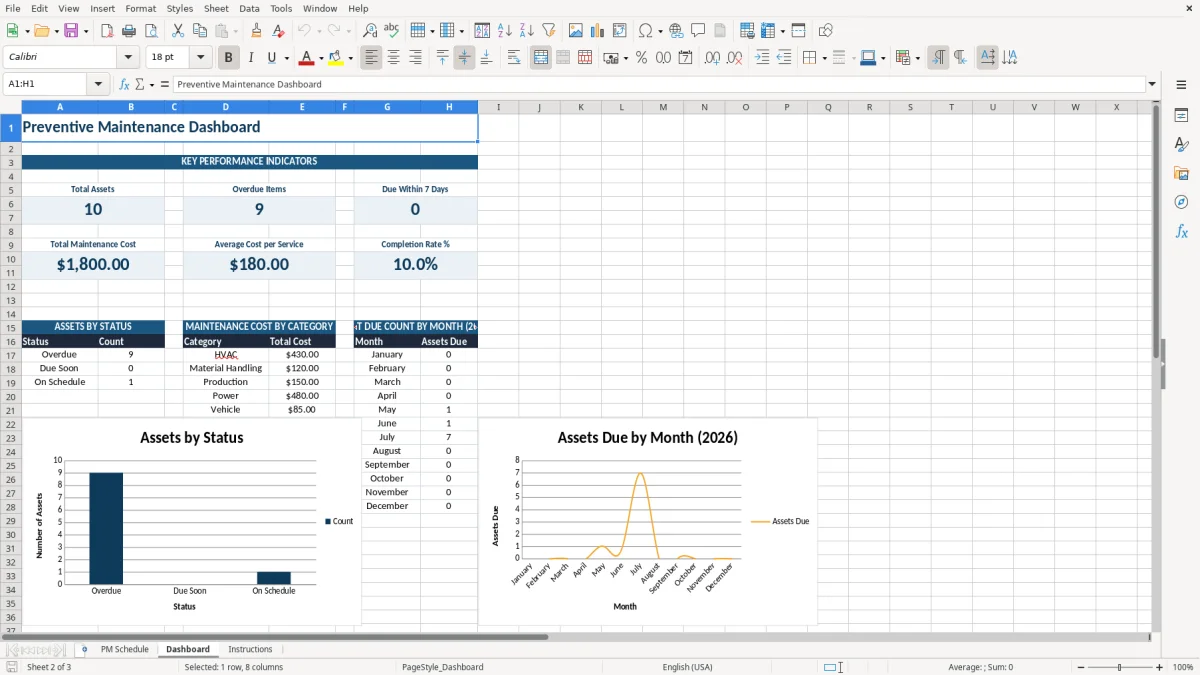
Image 2 shows KPI areas for Total Assets, Overdue Items, Due Within 7 Days, Total Maintenance Cost, Average Cost per Service, and Completion Rate %. The completion rate is calculated as the number of On Schedule records divided by the number of populated Asset IDs, so blank or incomplete rows should not be treated as completed work.
The Dashboard also groups maintenance cost by listed category using SUMIF and counts next due dates by month for 2026. The month section covers January through December 2026. If you enter a date outside that year, it will not appear in those monthly 2026 counts, although it can still affect the PM Schedule calculations.
The most expensive error is usually an incorrect Last Service Date. If a compressor was serviced on 06/20/2026 but you enter 06/02/2026, a 30-day interval shifts the next due date by 18 days. That can make an apparently current asset look overdue or hide work that should already be scheduled.
Leaving Asset ID, Location, or Serial Number blank makes it harder to identify the correct machine when several assets share the same equipment name. A technician may arrive at the right department but service the wrong unit, costing another visit and additional downtime.
Next Due Date, Days Until Due, and Status are calculated fields. Typing over one of them breaks the relationship between the service date and the Dashboard counts. For example, a manually typed On Schedule label can inflate the completion rate even when the calculated due date is already past.
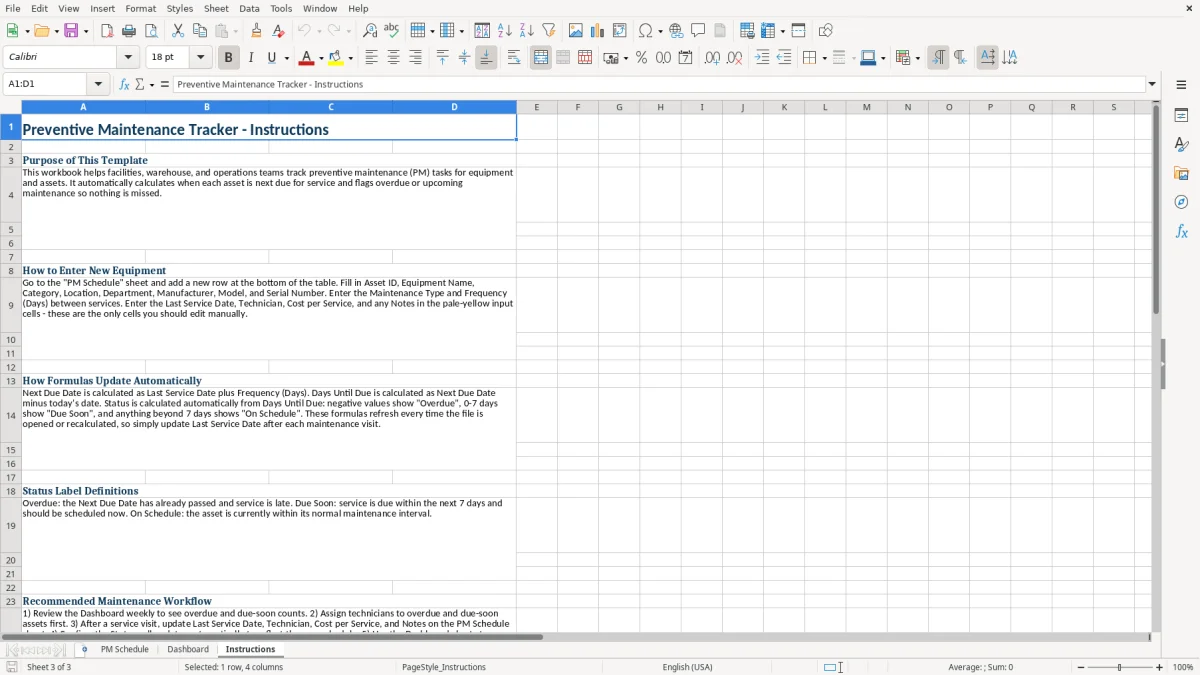
Enter Cost per Service as a numeric dollar amount such as $250.00, not as text. A text value may be excluded from totals or distort the Average Cost per Service metric. Image 3, the Instructions tab, explains the U.S. currency format and identifies the pale yellow cells intended for manual entry.
Choose one fixed review time each week, preferably before technician assignments are finalized. Open the Dashboard first, note the Overdue Items and Due Within 7 Days counts, then move to PM Schedule to assign technicians and confirm locations.
Updating the service date on the same day prevents the next cycle from being based on memory. Keep the asset's identity fields stable, especially Asset ID and Serial Number, so historical notes remain tied to the correct equipment.
The PM Schedule contains populated sample rows through row 11, with a summary formula in row 12, and it is not formatted as an Excel table. Treat the prepared area as a controlled starter workbook: when your asset list grows beyond the visible operating range, review formulas and Dashboard references before adding a large number of rows.
For a small facilities team, this workbook is a useful planning register. Once multiple technicians need simultaneous updates, work orders, parts usage, labor time, or audit history, a dedicated maintenance system will provide stronger control than a standalone XLSX file.
It tracks Asset ID, equipment name, category, location, department, manufacturer, model, serial number, maintenance type, service frequency, last service date, technician, cost per service, and notes. It also calculates the next due date, days until due, and status.
Next Due Date is calculated by adding Frequency (Days) to Last Service Date. For example, a 60-day frequency added to a 05/01/2026 service date produces a due date 60 days later.
Overdue means the calculated due date has passed. Due Soon means the item is due within 7 days. On Schedule means more than 7 days remain before the calculated due date.
The Dashboard includes total assets, overdue items, items due within 7 days, total maintenance cost, average cost per service, and completion rate. It also summarizes assets by status, cost by category, and next due counts by month for 2026, with three charts.
Edit the asset details, Maintenance Type, Frequency (Days), Last Service Date, Technician, Cost per Service, and Notes. Next Due Date, Days Until Due, and Status are calculated outputs and should not be manually replaced.
Yes. The workbook includes sample records such as an Air Handler Unit, Forklift 12, and HVAC Compressor. Replace those populated examples with your own equipment records before using the schedule for operational decisions.