HACCP Excel – Free Template (2026)
5
Free download
Track work orders, downtime, SLA compliance, labor, parts, maintenance costs, and 2026 monthly trends in an XLSX workbook.


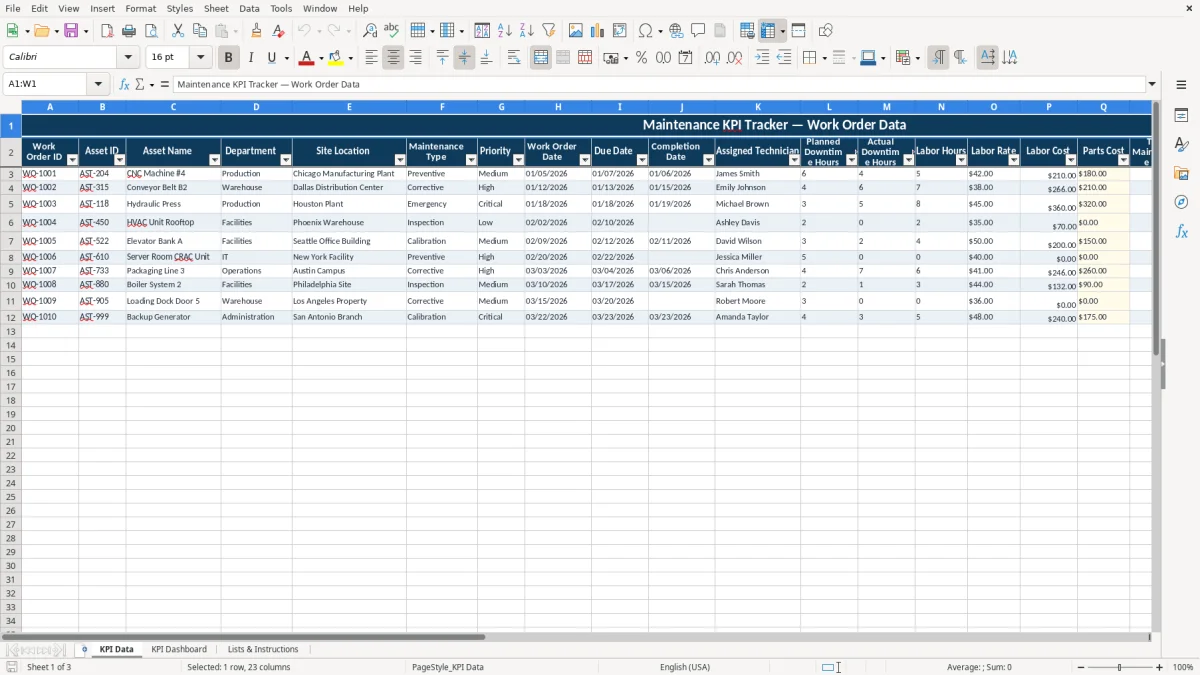
This maintenance KPI workbook records work orders and summarizes operational performance in Excel. It contains input rows for assets, technicians, dates, downtime, labor, parts, status, and SLA targets, plus calculated costs and KPI results.
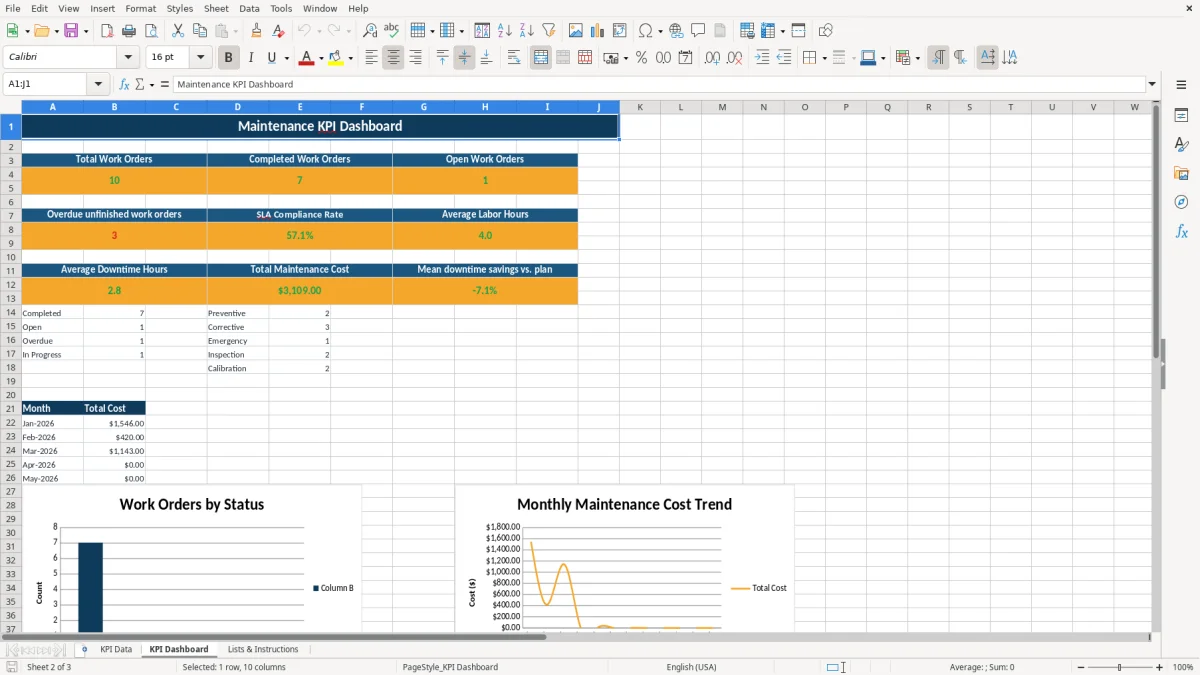
Use the KPI Data tab for one row per work order. The KPI Dashboard summarizes total, completed, open, and overdue work orders, SLA compliance, labor hours, downtime, maintenance cost, downtime savings versus plan, work-order status, maintenance type, and 2026 monthly cost trends.
A maintenance supervisor at a manufacturing plant can use the KPI Data tab during the daily work-order review. The fields cover the asset, site location, department, maintenance type, priority, assigned technician, planned downtime, actual downtime, and completion status, so the same row follows a job from assignment through closeout.
For example, the populated rows show equipment such as CNC Machine #4, Conveyor Belt B2, and Hydraulic Press across Chicago, Dallas, and Houston locations. A multi-site team can compare preventive, corrective, emergency, inspection, and calibration work without keeping separate paper lists for each facility.
An office coordinator or maintenance planner can update open and in-progress jobs before the weekly meeting. The dashboard then shows Total Work Orders, Completed Work Orders, Open Work Orders, and Overdue unfinished work orders, giving the team a direct list of workload and unfinished commitments.
Image 1 shows the detailed entry layout on KPI Data. The yellow cells are intended for manual inputs, while Labor Cost, Total Maintenance Cost, SLA Met?, and downtime savings versus plan are calculated fields. This distinction matters when several people enter data: users should update the source measurements rather than overwrite results.
A plant manager can use the dashboard after month-end to review Total Maintenance Cost, Average Labor Hours, Average Downtime Hours, and Mean downtime savings versus plan. The maintenance-type chart separates preventive, corrective, emergency, inspection, and calibration work, while the status chart separates completed, open, overdue, and in-progress orders.
The workbook includes ten example rows and formulas prepared in rows 3 through 12. Replace those examples with actual work orders before using the dashboard for an operating review.
The workbook uses direct operational formulas rather than a separate accounting or compliance rule set. In KPI Data, Labor Cost equals Labor Hours multiplied by Labor Rate. Total Maintenance Cost then equals Labor Cost plus Parts Cost, giving you a visible cost build-up for each work order.
SLA compliance is intentionally limited to completed work orders with a valid positive SLA target and valid actual downtime. The dashboard calculates SLA Compliance Rate from the rows marked Yes or No, excluding incomplete records that cannot produce a meaningful result.
The field labeled Downtime savings vs. plan % measures planned downtime against actual downtime. Its formula is 1 minus Actual Downtime Hours divided by Planned Downtime Hours. If planned downtime is 6 hours and actual downtime is 4 hours, the result is approximately 33.3% savings; if actual downtime is 8 hours, the result is approximately -33.3%, meaning an overrun rather than uptime.
Rows with missing or invalid downtime values do not produce a misleading result. That is important because an empty percentage should signal incomplete measurements, not successful performance.
Image 2 shows the dashboard layout with KPI cards, status and maintenance-type summaries, and the monthly cost section. The monthly cost formulas use work-order dates from January through December 2026, while the headline KPIs reference the recorded data range and are not limited to one year.
Use MM/DD/YYYY dates as instructed on Lists & Instructions. The workbook is delivered in XLSX format, and the monthly chart is specifically labeled for 2026; it should not be read as a rolling year chart.
The most damaging error is entering a completion status without the measurements needed to support it. A job marked Completed but missing Actual Downtime Hours, Labor Hours, or Parts Cost can distort cost, average downtime, and SLA analysis even though the work-order count still increases.
Suppose a technician closes a corrective job as Completed but leaves Parts Cost blank and does not enter Actual Downtime Hours. The dashboard may count the order as completed, yet its cost and downtime contribution will not represent the full job. Make closeout data part of the completion step instead of treating it as optional follow-up.
Another frequent problem is confusing planned downtime with actual downtime. The workbook's V result is savings versus plan, not uptime. If actual downtime exceeds the plan, the percentage is negative; changing the label or interpreting a negative value as a formula error would reverse the management decision.
Typing variations such as Corrective, corrective, and Corrective Work can split maintenance-type counts. The built-in dropdowns for Maintenance Type, Priority, Status, and Department reduce that risk, so use them rather than manually inventing category names.
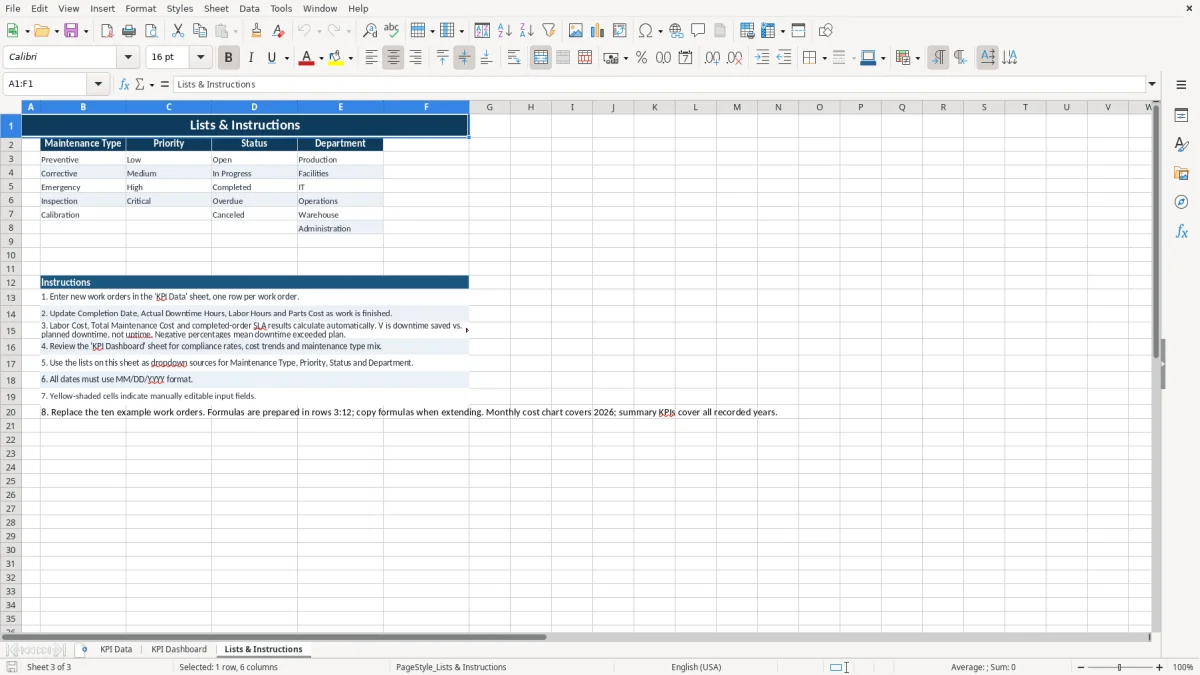
Date mistakes create a separate reporting problem. A date entered in an inconsistent format may prevent a work order from appearing in the intended 2026 monthly cost period. Image 3 shows Lists & Instructions, including the MM/DD/YYYY requirement and the guidance to replace the ten example work orders.
Do not type over Labor Cost, Total Maintenance Cost, SLA Met?, or downtime savings versus plan. If you extend the prepared rows, copy the formulas into the new rows; otherwise the dashboard can count the new order while its calculated outputs remain blank.
Set one fixed update point before the weekly maintenance meeting. The planner should enter new work orders, while the assigned technician or supervisor updates Completion Date, Actual Downtime Hours, Labor Hours, Parts Cost, and Status when the job closes.
This sequence protects the calculations because the workbook expects numeric inputs for hours, rates, and costs. It also prevents a completed order from being counted as operationally complete when its cost or downtime record is unfinished.
At month-end, compare Total Maintenance Cost with the monthly cost table on KPI Dashboard. The table has one row for each month of 2026, so use it for the 2026 operating review and use the headline KPIs when you need the broader recorded-data view.
Keep the Lists & Instructions tab available for new users. Image 3 identifies the permitted list values and explains that yellow-shaded cells are editable. When you add orders beyond the ten prepared rows, copy the calculated formulas and verify that the new rows feed the dashboard.
Move to a dedicated maintenance system when multiple users need simultaneous editing, asset history, approvals, notifications, or substantially more than the prepared workbook structure can comfortably manage. This XLSX file is best suited to a controlled work-order log and periodic KPI review.
It tracks work-order IDs, assets, departments, site locations, maintenance types, priorities, dates, technicians, planned and actual downtime, labor, parts, costs, status, SLA targets, notes, SLA results, and downtime savings versus plan.
Downtime savings versus plan compares planned downtime with actual downtime. A positive result means actual downtime was lower than planned; a negative result means actual downtime exceeded the plan. It is not an uptime percentage.
The workbook evaluates completed work orders with valid positive SLA targets and valid actual downtime. It marks SLA Met? as Yes when Actual Downtime Hours are at or below the SLA Target Hours and No when they exceed the target.
The dashboard includes total, completed, open, and overdue work orders; SLA Compliance Rate; Average Labor Hours; Average Downtime Hours; Total Maintenance Cost; Mean downtime savings versus plan; status and maintenance-type summaries; and monthly maintenance cost for 2026.
The workbook contains ten example rows with formulas prepared in rows 3 through 12. Replace the examples, then copy the formulas from the calculated columns into additional rows and continue using the dropdown lists for Maintenance Type, Priority, Status, and Department.