Crypto Portfolio Excel – Free Template (2026)
5
Free download
Compare properties, mortgage scenarios, monthly payments, offers, and closing costs with a four-tab XLSX home buying workbook.


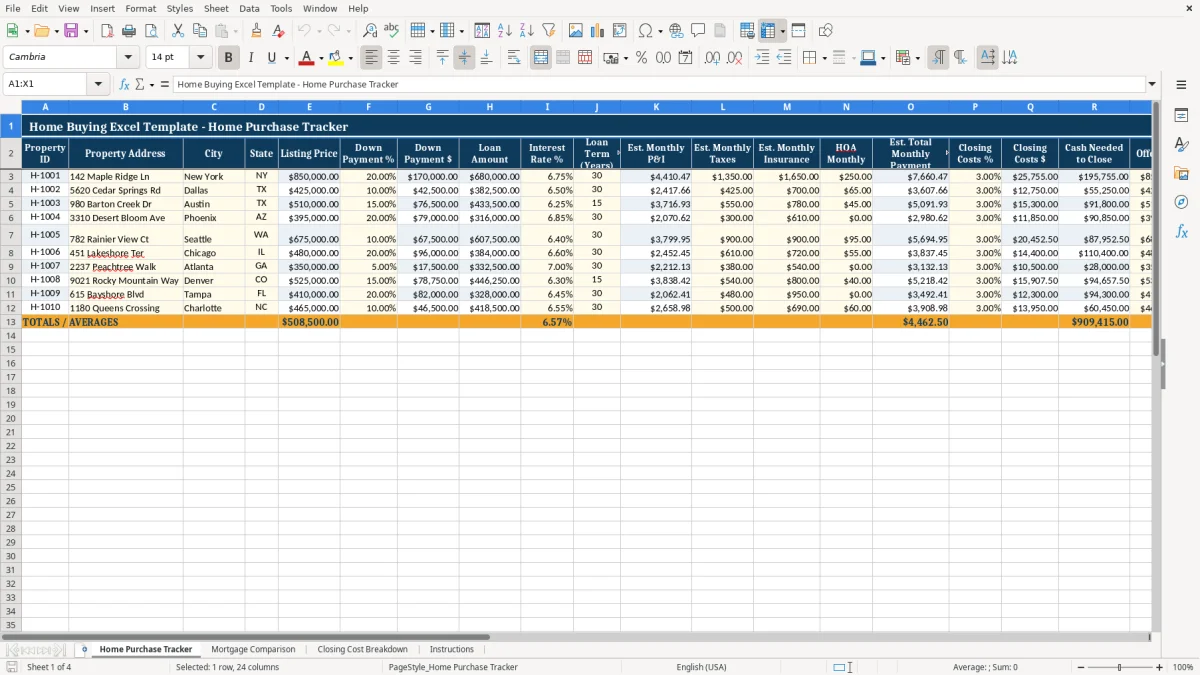
This home buying Excel template organizes property comparisons, mortgage scenarios, estimated monthly payments, offer details, and closing costs in one XLSX workbook. It contains four tabs: Home Purchase Tracker, Mortgage Comparison, Closing Cost Breakdown, and Instructions, with formulas that calculate loan amounts, payments, and cash needed to close.
Use the Home Purchase Tracker to compare up to 10 listed properties using price, down payment, interest rate, taxes, insurance, HOA dues, offer status, inspection status, closing date, and notes. The workbook contains sample 2026 transaction data, so replace those values with your own figures before relying on the results.
A household comparing several listings needs more than a list of addresses. The Home Purchase Tracker gives you one row per property, with fields for listing price, down payment percentage, interest rate, loan term, monthly taxes, insurance, HOA dues, offer price, inspection status, closing date, and notes. Image 1 shows the full comparison layout, including the calculated columns between the financing inputs and offer details.
The sample rows show why purchase price alone is a weak comparison. The New York property has a listing price of $850,000, a 20% down payment, $1,350 in monthly taxes, $1,650 in insurance, and $250 in HOA dues. The Dallas property lists at $425,000 with a 10% down payment, $425 in taxes, $700 in insurance, and $65 in HOA dues. Your actual monthly burden depends on every field, not just the listing number.
The sheet calculates down payment dollars as listing price multiplied by the down payment percentage, then subtracts that amount from the listing price to determine the loan amount. It also calculates estimated monthly principal and interest with PMT and adds taxes, insurance, and HOA dues to produce Est. Total Monthly Payment.
A buyer may review several homes while only one reaches an accepted offer. The Offer Status dropdown includes Pending, Accepted, Rejected, and Under Review; the Inspection Status dropdown includes Not Scheduled, Scheduled, Passed, Passed with Repairs, Failed, and Waived. These controlled choices make a weekly review easier than scanning free-form notes.
Use the Notes column for practical details such as the sample note about a preferred transit location and multiple offers. The Closing Date field also turns a general search list into a transaction checklist once an offer is accepted.
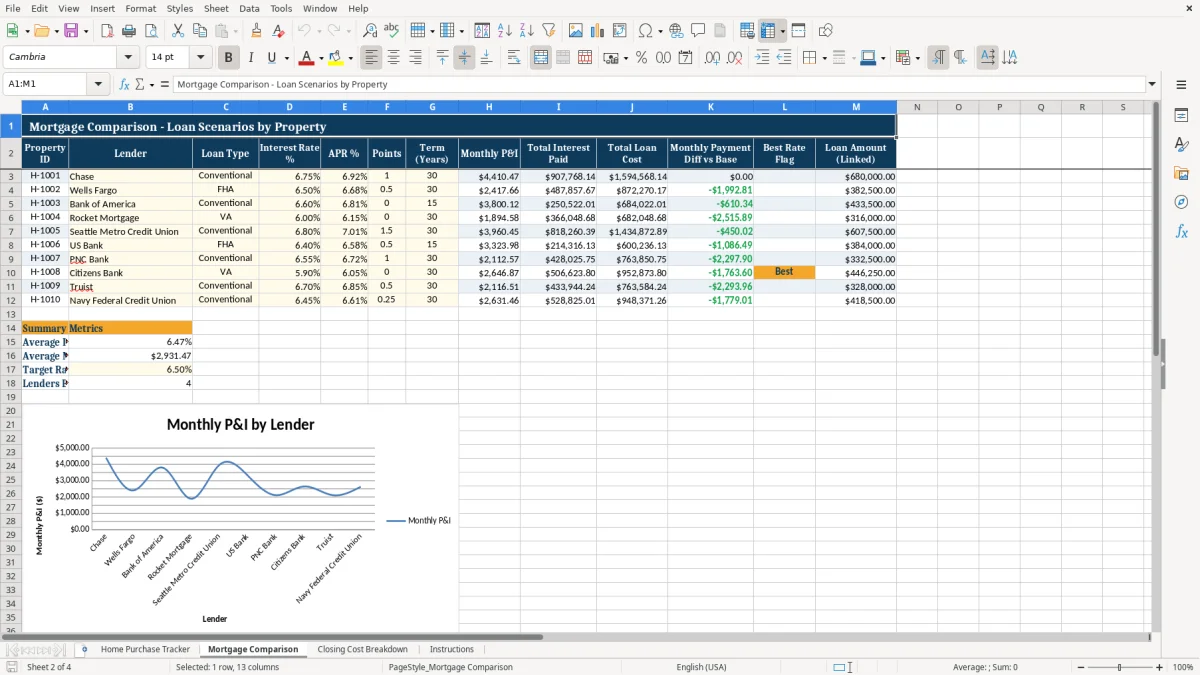
The Mortgage Comparison tab is designed for reviewing lender scenarios for the property IDs in the tracker. Image 2 shows columns for lender, loan type, interest rate, APR, points, term, monthly principal and interest, total interest paid, total loan cost, payment difference versus the base scenario, Best Rate Flag, and linked loan amount.
The workbook uses PMT to estimate monthly principal and interest from the entered interest rate, term, and linked loan amount. It calculates total interest by multiplying the monthly payment by the number of months and subtracting the loan amount. Total loan cost adds the points amount calculated from the points percentage and linked loan amount.
The sample scenarios include a 30-year conventional loan at 6.75%, a 30-year FHA loan at 6.50%, a 15-year conventional loan at 6.60%, and a 30-year VA loan at 6.00%. These are populated illustrations, not current quotes. Replace them with the figures from your lender's disclosures.
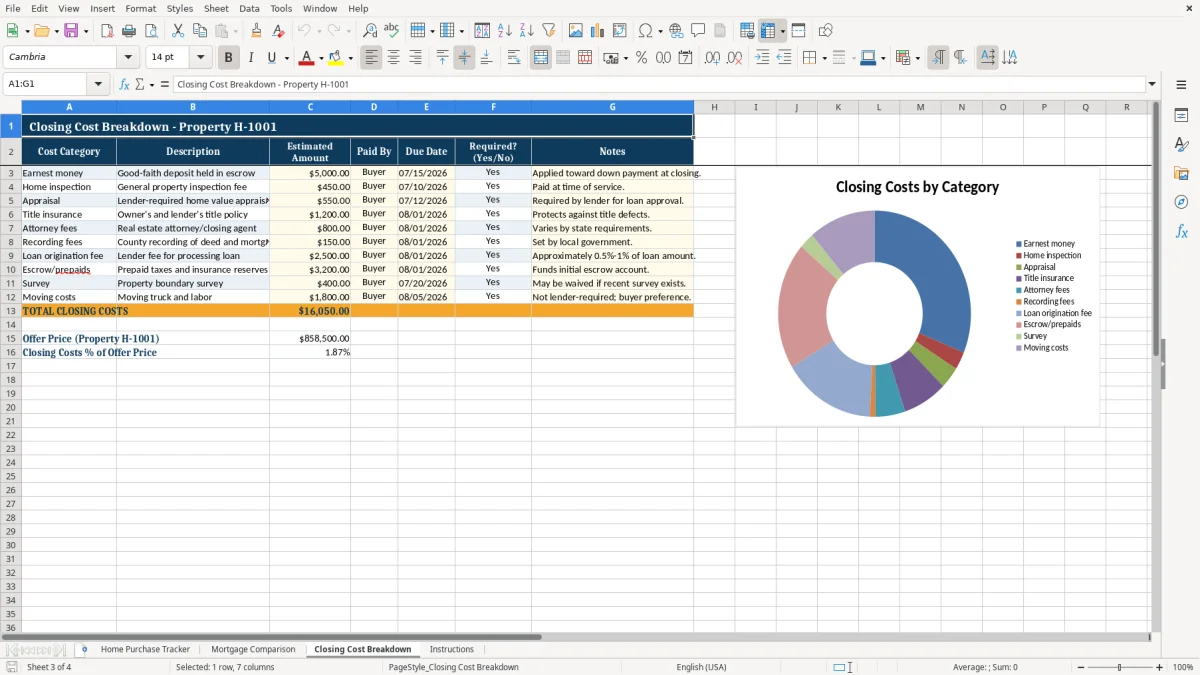
Image 3 shows the Closing Cost Breakdown tab. Its rows include earnest money, home inspection, appraisal, title insurance, attorney fees, recording fees, and loan origination fee, with columns for estimated amount, paid by, due date, required status, and notes. The workbook totals the estimated amounts and divides the total by the offer price linked from Home Purchase Tracker.
For example, the sample earnest money is $5,000, the inspection is $450, and the appraisal is $550. Those amounts are separate line items from the tracker’s percentage-based closing-cost estimate, so review both views and avoid adding the same fee twice when building your personal cash plan.
The most expensive mistake is treating the estimated monthly payment as a final mortgage quote. The workbook calculates principal and interest with PMT, then adds the entered taxes, insurance, and HOA dues. It does not include PMI unless you add it manually, and it does not replace a lender’s official disclosure.
Entering 6.75 instead of 6.75% changes the rate by a factor of 100. The Interest Rate % and Down Payment % cells use percentage formatting, so enter values as percentages in Excel. Similarly, Points are entered as a percentage-style loan charge in the mortgage comparison calculation; check the lender’s terminology before copying a quote.
A mismatched Property ID creates another problem. Mortgage Comparison uses VLOOKUP to bring the loan amount from columns A:H of Home Purchase Tracker. If you type H-1001 in one sheet and H-100I with a capital letter I in the other, the linked amount can return zero through IFERROR and make the payment comparison meaningless.
The tracker estimates closing costs by multiplying offer price by the entered Closing Costs %. Closing Cost Breakdown separately lists dollar amounts such as the sample $5,000 earnest money, $1,200 title insurance, and $2,500 loan origination fee. Combining both totals without checking the underlying assumptions can overstate the cash requirement.
Another common failure is leaving the sample dates and amounts in place. A closing date of 08/28/2026 and a due date of 07/15/2026 are examples from the workbook, not your contract. If you do not replace them, your timeline and cash schedule will describe someone else’s transaction.
Use the workbook at a fixed point in your home search instead of updating it only when an offer is due. A 20-minute review after each showing is enough to enter the property row, record the lender assumptions, and write one concrete note about location, condition, or competing offers.
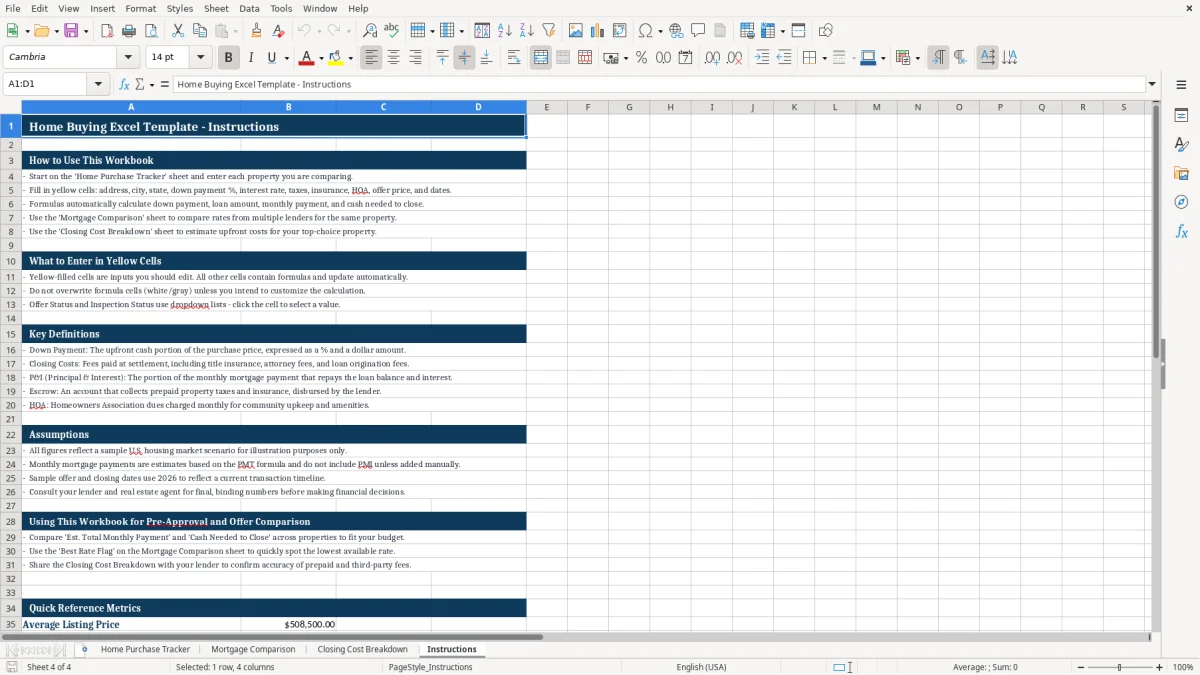
Follow the yellow-cell guidance on the Instructions tab. Enter assumptions in the input cells and leave white or gray formula cells unchanged. If you overwrite a formula in a calculated column, the row may stop updating even though the displayed number still looks reasonable.
Before comparing offers, check the Est. Total Monthly Payment and Cash Needed to Close columns together. A property that appears affordable monthly may require more upfront cash, while a lower-rate scenario may carry higher points or a longer total interest cost.
Image 4 contains the workbook instructions, definitions, assumptions, and quick-reference metrics. The XLSX file is a planning tool with sample U.S. housing figures; use the lender’s Loan Estimate and final closing disclosure for binding numbers. If you are tracking many homes, frequent lender revisions, or detailed transaction documents, move the authoritative records to your lender and closing records rather than relying on this workbook alone.
It calculates down payment dollars, loan amount, estimated monthly principal and interest, estimated total monthly payment, closing costs, cash needed to close, offer-versus-listing status, mortgage interest, total loan cost, and closing-cost totals.
The prepared tracker has property rows 3 through 12, allowing 10 property entries in the supplied workbook. The instructions and formulas are built around those prepared rows.
No. The Instructions tab states that the PMT-based monthly mortgage estimate does not include PMI unless you add it manually. Taxes, insurance, and HOA dues are separate entered amounts added to the estimate.
Enter a matching Property ID in Mortgage Comparison. Its VLOOKUP formula retrieves the loan amount from the Home Purchase Tracker, then PMT uses that linked amount with the entered rate and term.
Yes. Replace the sample estimated amounts, payer selections, due dates, and notes on Closing Cost Breakdown. The sheet totals the entered amounts and compares that total with the offer price linked from the tracker.
No. They are populated illustrations in the workbook, including sample 2026 dates and lender scenarios. Replace them with your lender’s current figures and confirm final amounts in official loan and closing documents.