Financial Budget Excel – Free Template (2026)
6
Free download
Track crypto holdings, transactions, manual prices, values, gains, allocation, and dashboard summaries in a USD XLSX workbook.


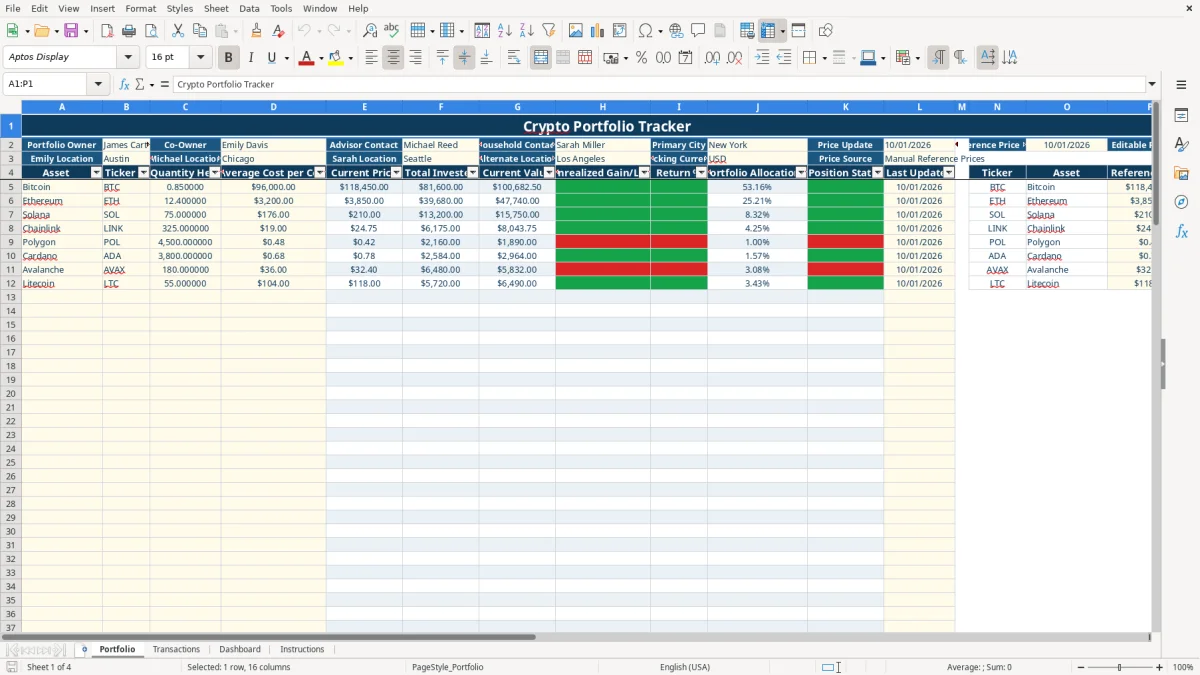
This crypto portfolio Excel template records cryptocurrency holdings, buy, sell, and transfer activity, then calculates invested cost, current value, unrealized gain or loss, return, and allocation in U.S. dollars. It contains Portfolio, Transactions, Dashboard, and Instructions tabs with manual price inputs and prepared calculation rows.
Use the Portfolio tab to enter quantities and average costs, the Transactions tab to preserve activity details, and the Dashboard to review totals and asset performance. The workbook does not connect to an exchange or refresh prices automatically; you update the reference prices yourself.
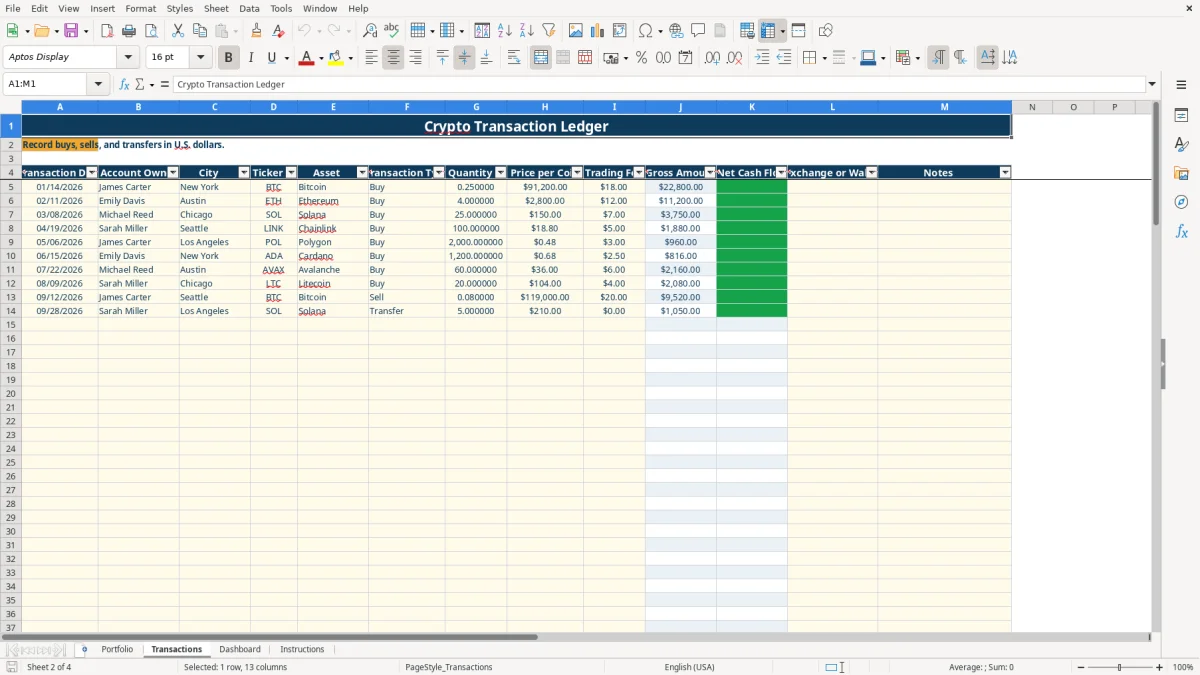
A household with several crypto owners needs a single record when assets sit across Coinbase, Kraken, Robinhood, Fidelity Crypto, or a Ledger Wallet. This workbook separates account owner, city, exchange or wallet, and transaction notes, so a January buy by James Carter in New York does not get confused with an Austin purchase entered for Emily Davis.
Start with the Portfolio tab when you want a snapshot of what is held now. The sample includes Bitcoin, Ethereum, Solana, and other supported assets, while rows 5 through 104 are prepared for holdings. If you hold 0.85 BTC at an average cost of $96,000, the sheet calculates total invested as $81,600 before comparing it with the manual reference price.
Use Transactions when you need the story behind the balance. The sample records a 0.25 BTC buy at $91,200 with an $18 fee, a 4 ETH buy at $2,800 with a $12 fee, and a 25 SOL buy at $150 with a $7 fee. Recording each event immediately is more reliable than reconstructing twelve months of trades from email confirmations.
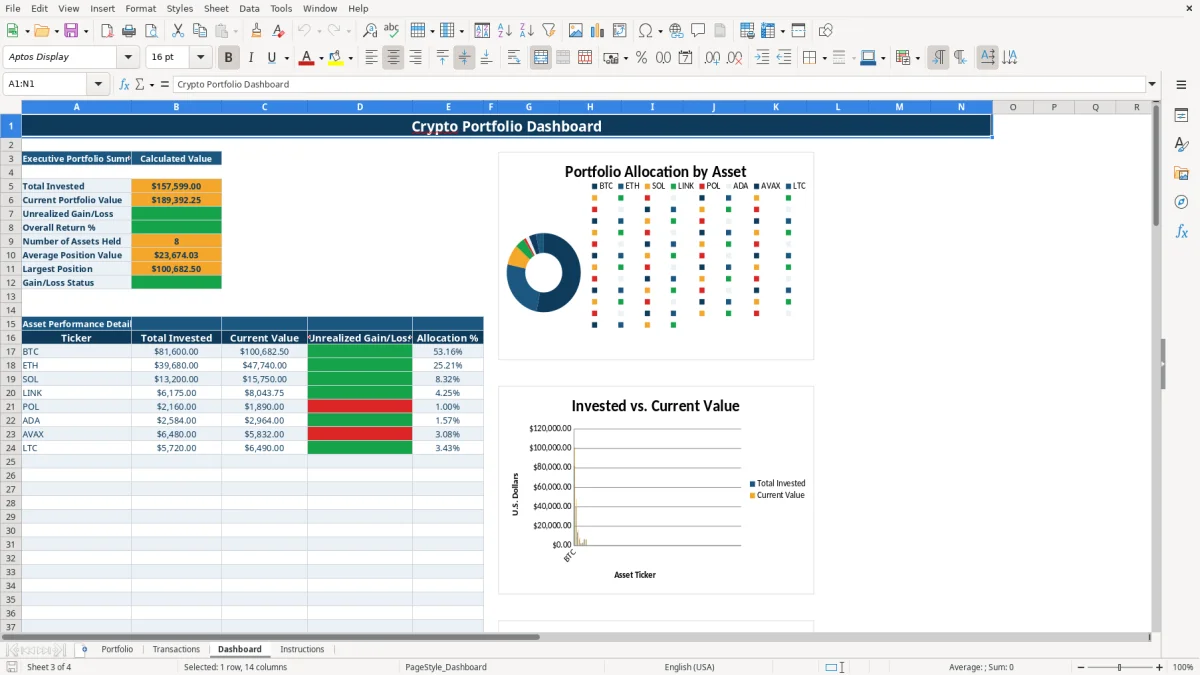
The Dashboard is for a monthly household review rather than a live trading screen. It summarizes invested value, current value, unrealized gain or loss, return percentage, asset count, average position value, and largest position, then presents three charts for comparison.
This workbook is a manual tracker, not a price feed. The Portfolio tab identifies the price source as Manual Reference Prices, shows a reference date of 10/01/2026 in the sample, and stores ticker, asset, and reference price in columns N through P.
When you review the file, replace the sample reference prices with the prices you choose to use and update the reference date. The Current Price formula uses VLOOKUP to match a ticker against the reference list; if the ticker is blank or unmatched, the workbook does not produce a reliable market value.
The workbook calculates total invested as quantity held times average cost, and current value as quantity held times current price. For example, 4 ETH at an average cost of $2,800 produces $11,200 invested; a manually entered price of $3,000 would produce $12,000 current value and $800 unrealized gain.
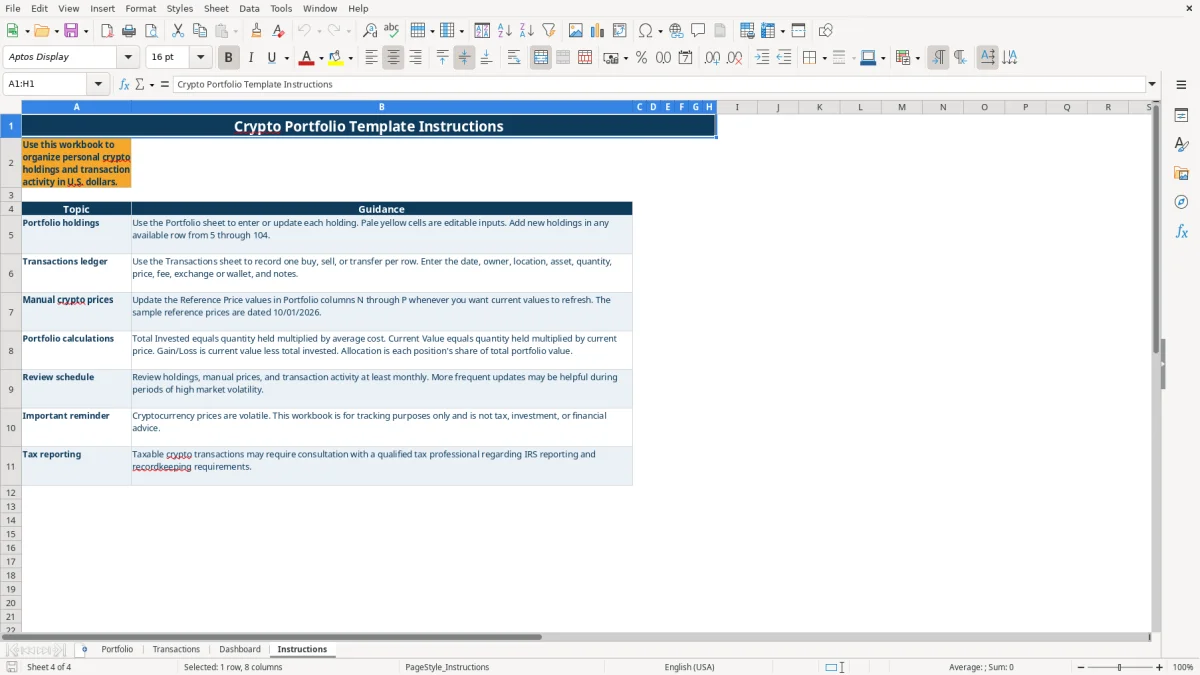
There is no live exchange integration, chart feed, tax-lot engine, or tax-return output. The Instructions tab explicitly says the workbook is for tracking only and is not tax, investment, or financial advice. Use transaction exports and other source records separately when preparing any tax reporting.
The most damaging error is a stale price list. If you hold 0.85 BTC and leave a reference price unchanged while the market moves, the displayed current value and unrealized gain or loss can be materially wrong even though every formula is working correctly.
A ticker is the lookup key, so inconsistent entries create misleading results. Entering BTC for Bitcoin in one place and a different ticker in another can leave the Current Price at zero or connect a holding to the wrong reference row. Use the provided drop-down lists instead of typing variants.
Ignoring trading fees understates cash used for buys and overstates cash received from sells. In the sample, the 0.25 BTC purchase has a gross amount of $22,800 and an $18 fee, making net cash flow $22,818 for a buy. That $18 difference is small once, but 40 trades at $18 each becomes $720.
Entering only the current balance loses dates, owners, wallets, and transfer notes. A transfer may not represent a purchase, and treating it as one can distort your personal records. Review the 100 prepared transaction rows before year-end rather than assuming the Portfolio tab explains every movement.
Choose one recurring date for maintenance, such as the first Saturday of each month. Download or gather your exchange and wallet records, enter new activity in Transactions, then update the manual reference prices and date in Portfolio before reading the Dashboard.
Use the existing validations for assets, tickers, transaction types, dates, quantities, prices, and wallets. Avoid overwriting calculated columns such as Total Invested, Current Value, Gross Amount, and Net Cash Flow; those cells are designed to calculate from your inputs.
The workbook has 100 prepared rows for Portfolio holdings and 100 prepared rows for transaction activity. If you need many years of wallet-level history, automatic exchange imports, tax-lot matching, or continuous prices, move to a dedicated portfolio or accounting system and retain this workbook as a readable summary.
No. It uses manual reference prices in Portfolio columns N through P. Update those values and the reference date yourself; there is no live exchange integration or data feed.
It calculates total invested, current value, unrealized gain or loss, return percentage, portfolio allocation percentage, and gain-or-loss status from your quantity, average cost, ticker, and manual reference price inputs.
Yes. The Transactions tab includes Buy, Sell, and Transfer as transaction types. Enter one activity per row along with the date, owner, asset, quantity, price, fee, exchange or wallet, and notes.
No. It is a tracking workbook and does not calculate tax lots, taxable gain, or a tax return. Keep supporting exchange and wallet records and use appropriate professional guidance for tax reporting.
The Dashboard shows total invested, current portfolio value, unrealized gain or loss, overall return percentage, number of assets held, average position value, largest position, gain-or-loss status, asset detail, and three summary charts.