Case Tracker Excel – Free Template (2026)
4
Free download
Model project revenue, costs, cash flow, break-even timing, risk, and feasibility in an XLSX workbook for U.S. business planning.


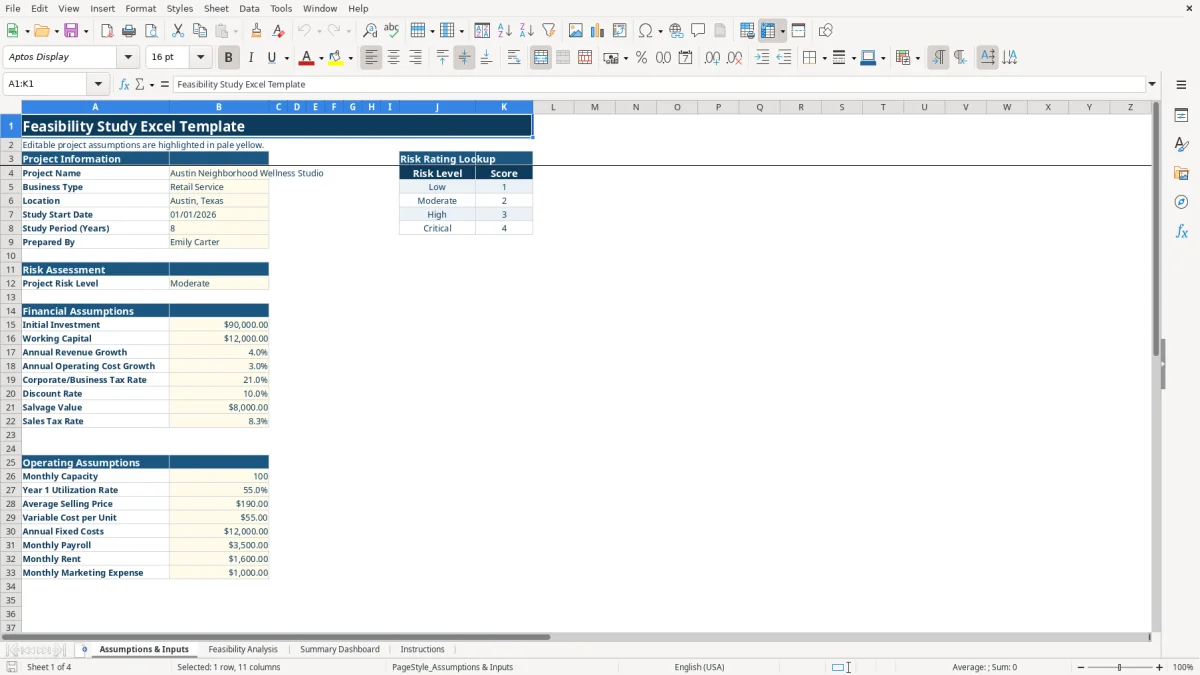
A feasibility study evaluates whether a proposed project can support its investment, operating costs, cash-flow needs, and risk. This XLSX workbook contains editable assumptions, an annual projection model, a summary dashboard, and instructions for reviewing a project over up to 100 fiscal years.
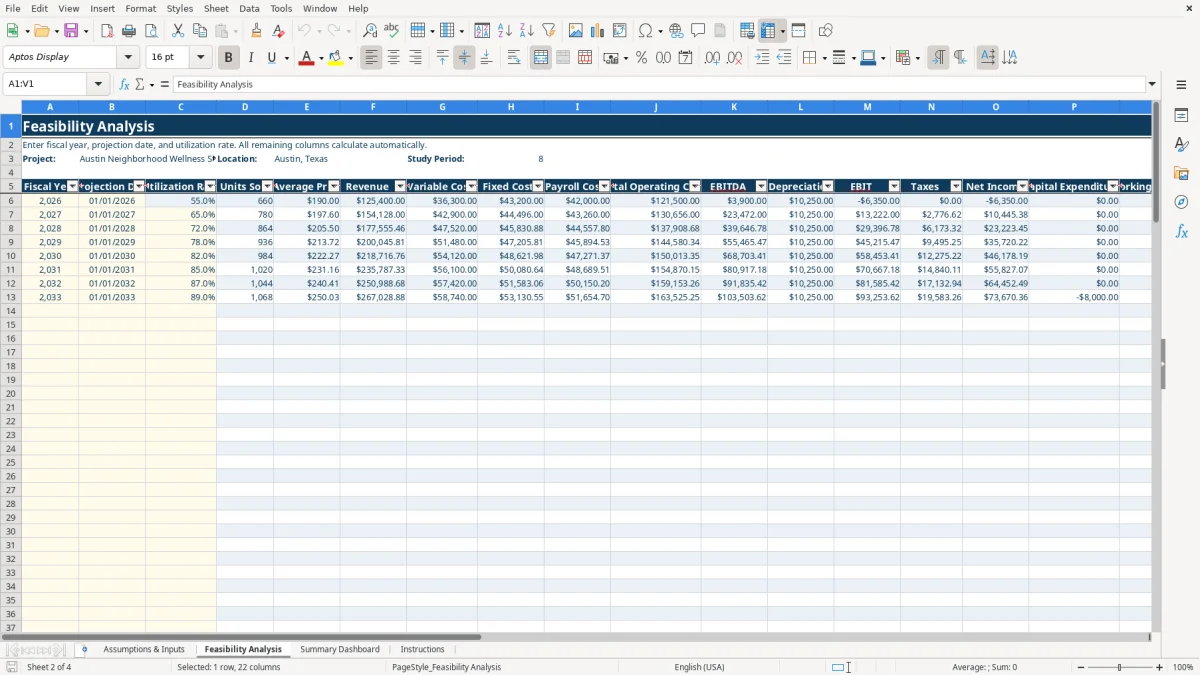
Use the Assumptions & Inputs tab for project details, financial rates, capacity, pricing, costs, and risk level. The Feasibility Analysis tab calculates revenue, operating costs, EBITDA, taxes, free cash flow, break-even units, profit margin, and status; image 1 shows the input layout and image 2 shows the annual analysis grid.
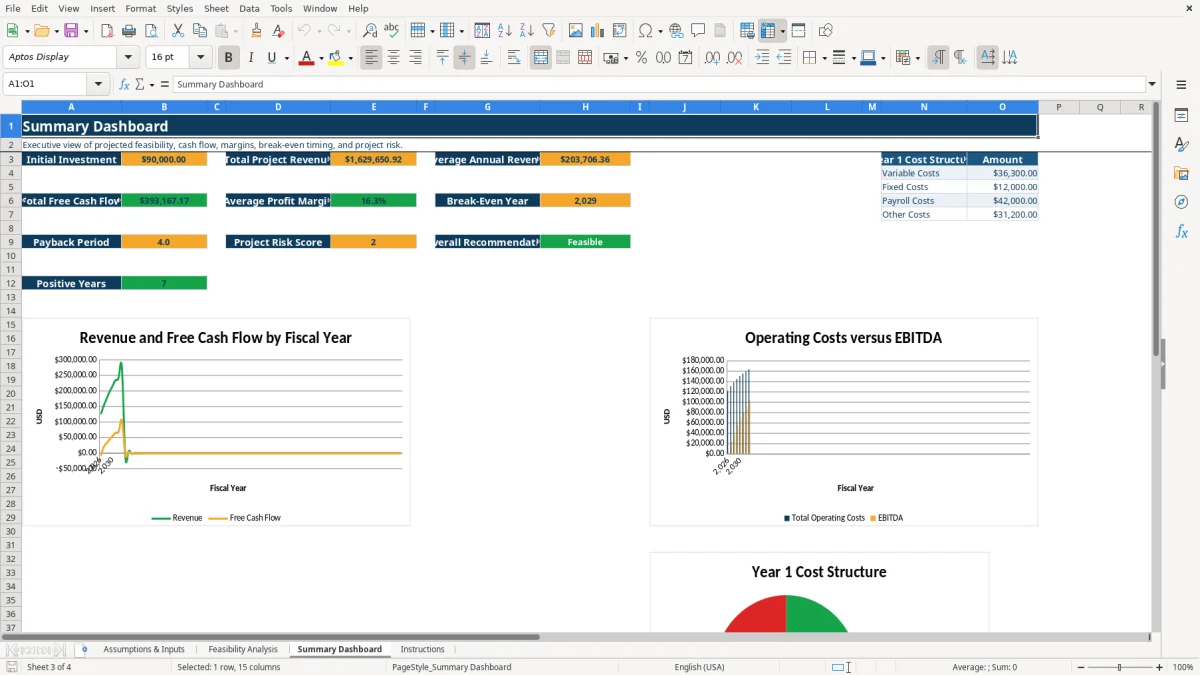
The Summary Dashboard consolidates investment, revenue, free cash flow, margin, break-even year, payback period, risk score, recommendation, positive years, and three charts. Image 3 shows the executive view, while image 4 shows the workbook instructions and entry guidance.
A feasibility model is useful when a business owner, lender, investor, or management team needs to decide whether a proposed operation deserves funding. A retail service owner may test a new location; a professional-service firm may compare hiring space and capacity; a nonprofit treasurer may assess whether a new program can cover its operating commitment.
The workbook is especially useful before signing a lease, ordering equipment, or committing working capital. The sample project starts with a $90,000 initial investment and $12,000 of working capital, giving you a concrete structure for testing whether the proposed operation can recover its outlay.
Enter the business type, location, study start date, and study period first. A project beginning on 01/01/2026 with an 8-year study period can then be evaluated through its annual revenue, costs, cash flow, and ending assumptions rather than through a single optimistic first-year estimate.
An owner can change capacity and utilization to test demand. A lender can focus on cumulative cash flow and break-even year. An operations manager can examine payroll, fixed costs, and variable costs separately before presenting the recommendation.
The analysis uses linked assumptions rather than isolated figures. Units sold are calculated as monthly capacity multiplied by 12 and the utilization rate. Revenue then equals units sold multiplied by average price, while average price grows from the starting assumption using the annual revenue growth rate.
Operating costs are separated into variable costs, fixed costs, and payroll costs. Total operating costs feed EBITDA; depreciation produces EBIT; the tax formula applies the entered business tax rate only when EBIT is positive. This is a planning model, so the rates shown in the input area are editable assumptions, not a statement of current law.
Free cash flow combines net income and depreciation, then accounts for capital expenditures and working capital changes. The model applies the initial investment at the beginning of the study, includes the entered salvage value in the final study year, and calculates cumulative cash flow to identify the break-even year.
Input validation limits the study period to whole numbers from 1 to 50, utilization and rate fields to decimals from 0 to 1, and fiscal years to 1900 through 2200. The prepared analysis area contains rows through row 105, while the instructions describe projections for up to 100 fiscal years; use only the rows supported by your study period.
The most damaging error is entering an attractive utilization rate without checking whether the capacity and price assumptions support it. For example, changing utilization from 0.65 to 0.85 changes units sold directly, so revenue and variable costs move together while fixed and payroll costs may continue to grow at their separate rates.
Another problem is treating a positive accounting result as proof of available cash. The workbook distinguishes net income from free cash flow by including capital expenditures and working capital changes. A project can show positive EBITDA while cumulative cash flow remains below zero because the initial investment and working capital requirement have not been recovered.
Entering 8 instead of 0.08 for an 8.0% rate is prevented by the decimal validation, but pasted or manually altered cells still deserve review. Also check that the projection date matches the fiscal year; the growth formulas use the year of the study start date when escalating prices and costs.
The dashboard labels a project Feasible only when total free cash flow is positive and average profit margin is at least 15%. Treat that result as the workbook's defined screening rule, not as a guarantee of financing, demand, or future performance. Review the underlying years, especially any row marked Review.
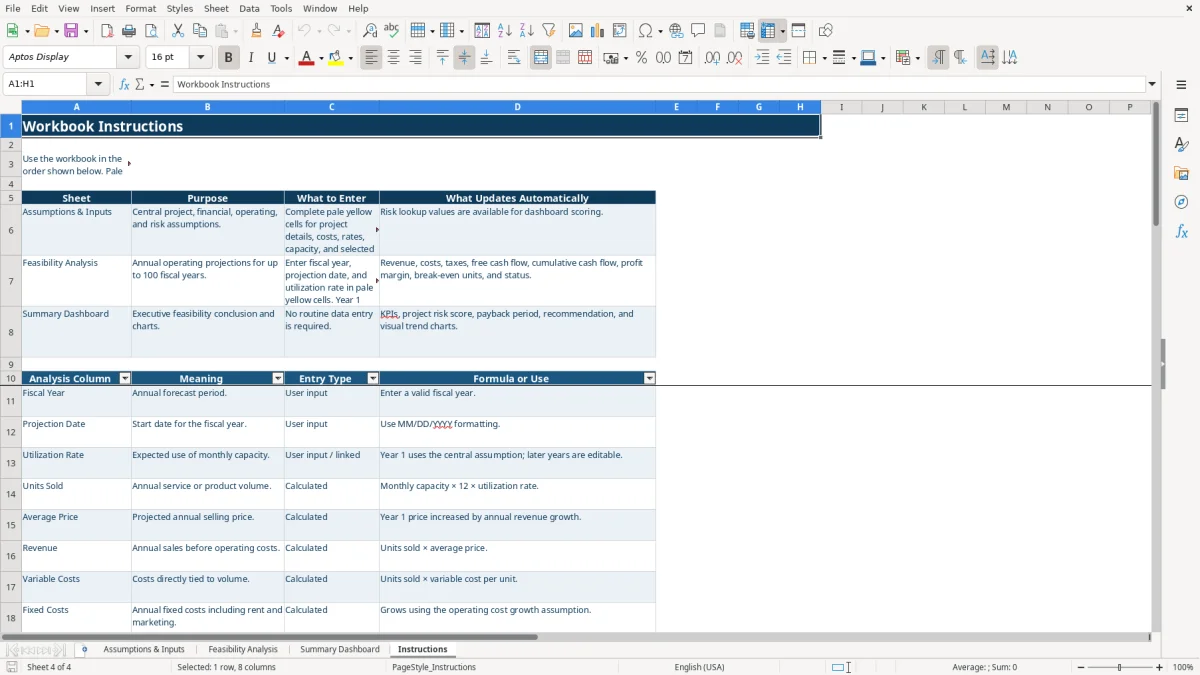
Build the model in one controlled review session, then schedule a second review before presenting it. Start with the pale yellow cells on Assumptions & Inputs, move through the annual utilization entries, and finish by checking the dashboard against the analysis rows.
Begin with initial investment and total project revenue, then discuss average profit margin, break-even year, payback period, and risk score. The Year 1 cost structure chart makes it easier to ask whether variable costs, fixed costs, payroll, or other costs deserve the next investigation.
Keep the workbook as an XLSX file and preserve the four tabs. When the project requires transaction-level actuals, multiple scenarios, user permissions, or ongoing accounting records, move the operating data into a dedicated accounting or planning system and use this workbook for the focused feasibility review.
It includes Assumptions & Inputs, Feasibility Analysis, Summary Dashboard, and Instructions tabs. The workbook covers project assumptions, annual operating projections, cash flow, profitability, break-even measures, risk scoring, recommendations, and charts.
Edit the pale yellow cells on Assumptions & Inputs and the designated fiscal year, projection date, and utilization cells on Feasibility Analysis. The remaining analysis and dashboard values are formula-driven.
The study-period input accepts whole numbers from 1 to 50. The Feasibility Analysis sheet is prepared with rows through row 105, and the Instructions tab describes the analysis as supporting up to 100 fiscal years.
The dashboard displays Feasible when total free cash flow is positive and average profit margin is at least 15%; otherwise it displays Requires Review. This is the workbook's screening rule and should be evaluated alongside the individual projection years.
Yes. The Summary Dashboard contains three charts: revenue and free cash flow by year, total operating costs and EBITDA by year, and the Year 1 cost structure.