Client Onboarding Excel – Free Template (2026)
2
Free download
Track agent reviews, CSAT, FCR, response times, QA scores, targets, coaching status, and team KPIs in an XLSX scorecard.


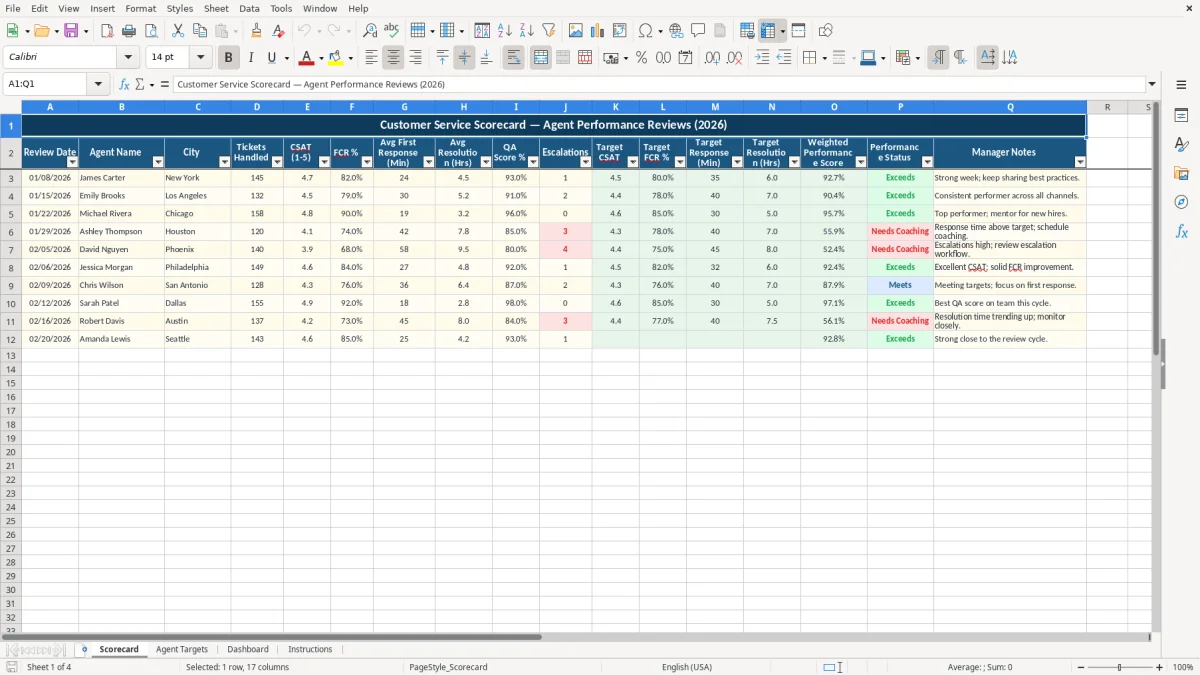
A customer service scorecard Excel template records agent reviews in one worksheet and compares service results with individual targets. It includes fields for review date, agent, city, tickets handled, CSAT, FCR, response time, resolution time, QA score, escalations, and manager notes.
The workbook has four tabs: Scorecard, Agent Targets, Dashboard, and Instructions. Image 1 shows the main review table, while the other tabs organize target settings, calculated team summaries, charts, and operating guidance.
A customer service manager, team lead, or operations supervisor can use this workbook during weekly or monthly agent reviews. The Scorecard tab is designed for one review per row, with fields that connect customer sentiment to operating speed: CSAT, FCR, average first response, average resolution, QA Score, and escalations.
A contact-center lead can enter January 8, January 15, and January 22 reviews as separate rows for different agents. The sample rows show James Carter with 145 tickets, Emily Brooks with 132, and Michael Rivera with 158, giving a manager both quality measures and workload context.
The City field also helps a distributed support team compare records from New York, Los Angeles, and Chicago without creating separate workbooks. Manager Notes provide a place to preserve the reason behind a result, such as recognizing a strong week or assigning mentoring work.
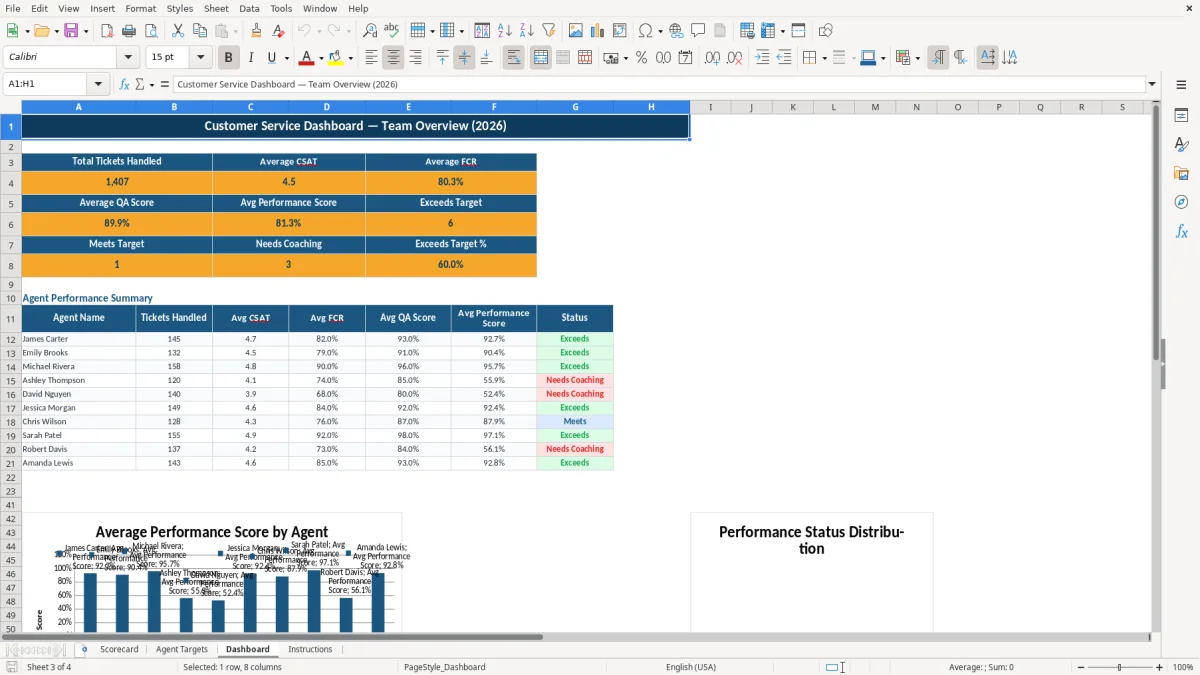
During a one-on-one meeting, you can discuss whether the agent met the target for CSAT, FCR, response time, and resolution time. The Dashboard then provides a team-level view: total tickets handled, average CSAT, average FCR, average QA Score, average performance score, and counts by status.
This is especially useful when a supervisor needs to move from a broad statement such as service quality declined to a specific conversation. An agent may have a high CSAT but slower resolution time, while another may handle more tickets but need coaching on QA results.
The workbook includes prepared rows through row 12 and sample agents in the target list, rather than a database or live service-platform connection. For a small team, that makes it practical for a defined review cycle; a larger operation should confirm the prepared range and reporting process before relying on it for high-volume records.
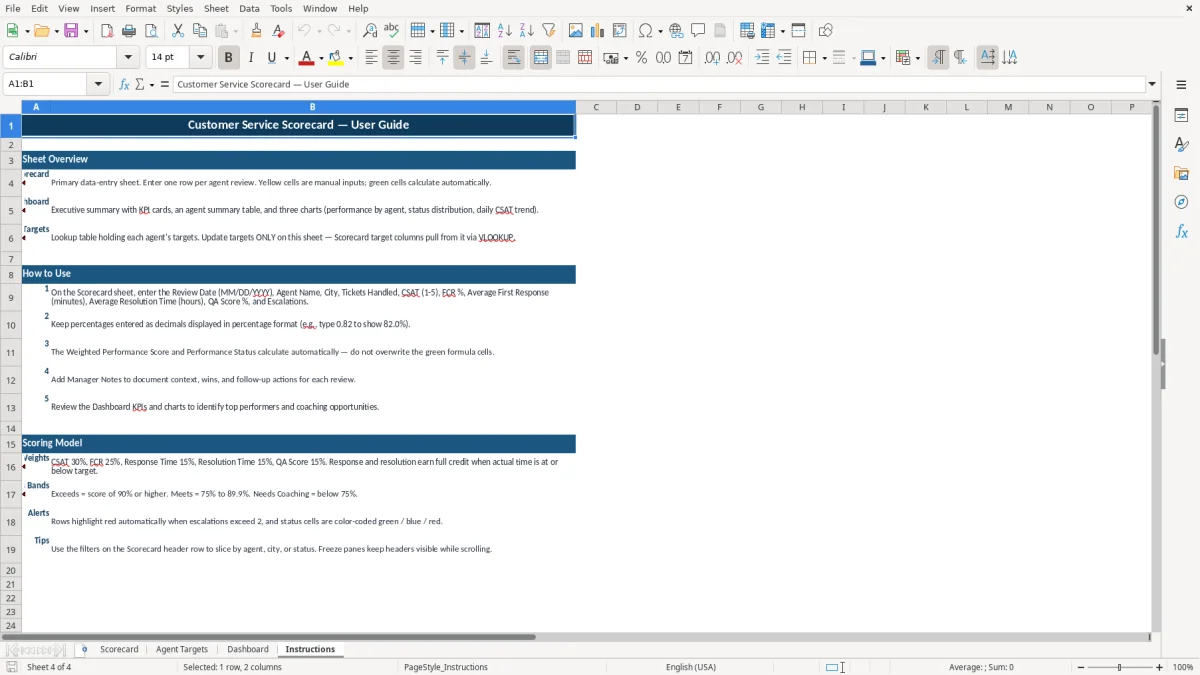
The workbook uses a defined scoring model rather than treating every service measure as equally important. CSAT contributes 30%, FCR contributes 25%, response time contributes 15%, resolution time contributes 15%, and QA Score contributes 15%.
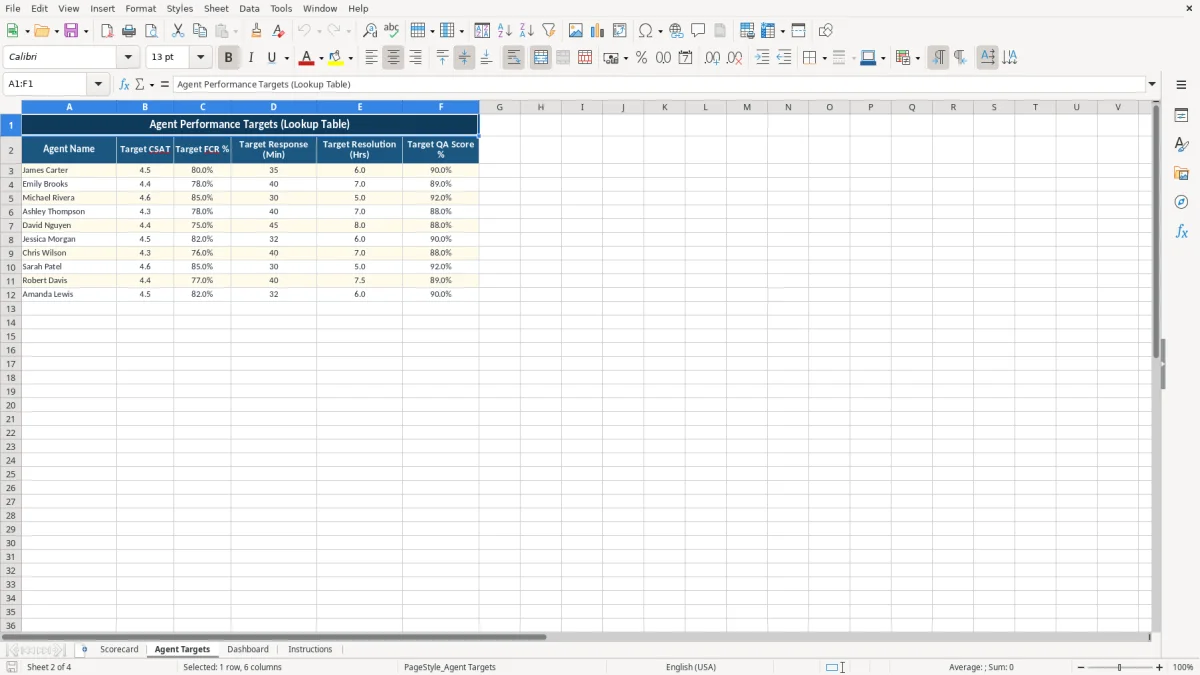
When an agent name in Scorecard matches Agent Targets, VLOOKUP retrieves the target CSAT, target FCR percentage, target response minutes, and target resolution hours. The formulas use the Agent Targets range A2:F11, so the name must match the target-table spelling for the lookup to return a value.
For example, James Carter's target row shows CSAT 4.5, FCR 0.80, response time 35 minutes, resolution time 6 hours, and QA Score 0.90. His sample review records CSAT 4.7, FCR 0.82, first response of 24 minutes, resolution of 4.5 hours, and QA Score 0.93.
The score formula normalizes CSAT by dividing it by 5, applies the listed weights, and awards the response and resolution portions when actual times are at or below the corresponding targets. QA Score and FCR are used as decimal percentages, so 0.82 represents 82.0% rather than 0.82%.
Status is calculated with IF: a score of 0.90 or higher is Exceeds, a score from 0.75 through 0.899999 is Meets, and a result below 0.75 is Needs Coaching. These are workbook scoring bands, not employment, compensation, or legal standards.
The Dashboard uses SUM, AVERAGE, AVERAGEIF, SUMIF, and COUNTIF formulas. Its agent summary calculates tickets, average CSAT, average FCR, average QA Score, average performance score, and status for the named agents listed in rows 12 through 21.
The most damaging scorecard errors usually begin with inconsistent entry rather than a complicated formula. A manager who types 82 instead of 0.82 for FCR changes an intended 82.0% input into a number that does not match the workbook's percentage convention. The Instructions tab specifically directs users to enter percentages as decimals.
Target columns depend on an exact agent-name match. If the Scorecard says Michael Riveira while Agent Targets says Michael Rivera, VLOOKUP returns a blank target. The performance calculation can then produce an unreliable result because response and resolution comparisons no longer have the intended target values.
Do not rename agents casually or maintain a second target list in the Scorecard. Update targets on Agent Targets, where the workbook expects them, and use the same spelling in every review row.
The Dashboard summarizes the Scorecard range rather than interpreting business periods for you. Mixing a single weekly review with several monthly records can distort averages. For example, 145 tickets in one sample review and 158 in another are useful only when the review dates represent comparable periods.
A status label alone does not explain why an agent performed that way. Escalations, city, ticket volume, and Manager Notes add context. A row with 158 tickets and zero escalations tells a different coaching story from a row with similar volume and several escalations, even if the weighted score is close.
Also note that the workbook's instructions describe red highlighting when escalations exceed 2 and color-coded status cells. Treat those visual signals as prompts for review, not as automatic disciplinary conclusions. Confirm the underlying entries and notes before acting on a result.
The scorecard works best when you attach it to a fixed review habit instead of completing it only when a performance conversation is due. Choose one recurring time, such as the final support-team meeting of each week, and enter the review date, metrics, and notes while the period is still easy to identify.
This order prevents a manager from writing a coaching conclusion before seeing the actual response time, resolution time, QA Score, and escalations. It also keeps the Dashboard aligned with the latest completed review rows.
Start with the KPI cards, then move to the agent performance summary. The three charts cover performance by agent, status distribution, and the daily CSAT trend, giving you a quick sequence from individual results to team patterns.
For example, if the Dashboard shows several Needs Coaching results but the average CSAT remains strong, use the Scorecard columns to determine whether response time, resolution time, FCR, or QA Score is driving the difference.
This XLSX workbook has a defined Scorecard area through row 12 and Dashboard summaries tied to specified ranges. If your team routinely exceeds those prepared rows or requires historical reporting across many review cycles, do not assume that typing below the visible area will update every formula and chart.
At that point, use a controlled expansion process or move to a customer-service platform that stores review history and reporting dimensions natively. Until then, keep one agreed naming convention and one target source so the workbook remains dependable.
It tracks review date, agent name, city, tickets handled, CSAT from 1 to 5, FCR percentage, average first response in minutes, average resolution in hours, QA Score percentage, escalations, target values, weighted performance score, performance status, and Manager Notes.
The workbook includes Scorecard for data entry, Agent Targets for lookup values, Dashboard for KPI summaries and three charts, and Instructions for usage and scoring guidance.
The score uses CSAT at 30%, FCR at 25%, response time at 15%, resolution time at 15%, and QA Score at 15%. Response and resolution receive their weighted credit when the actual time is at or below the target.
Exceeds means the calculated score is at least 90%. Meets covers scores from 75% through 89.9%, and Needs Coaching applies below 75%.
Change target CSAT, FCR, response time, resolution time, and QA Score on the Agent Targets tab. The Scorecard target columns pull values from that sheet with VLOOKUP formulas.
The Dashboard contains formulas that summarize the Scorecard range, including SUM, AVERAGE, AVERAGEIF, SUMIF, and COUNTIF calculations. Its charts use the dashboard's prepared summary and chart-data ranges, so review the defined workbook area before adding records beyond it.