Client Onboarding Excel – Free Template (2026)
2
Free download
Track post metrics across six platforms, calculate engagement, CTR, CPC, and review platform and content-type summaries in XLSX format.


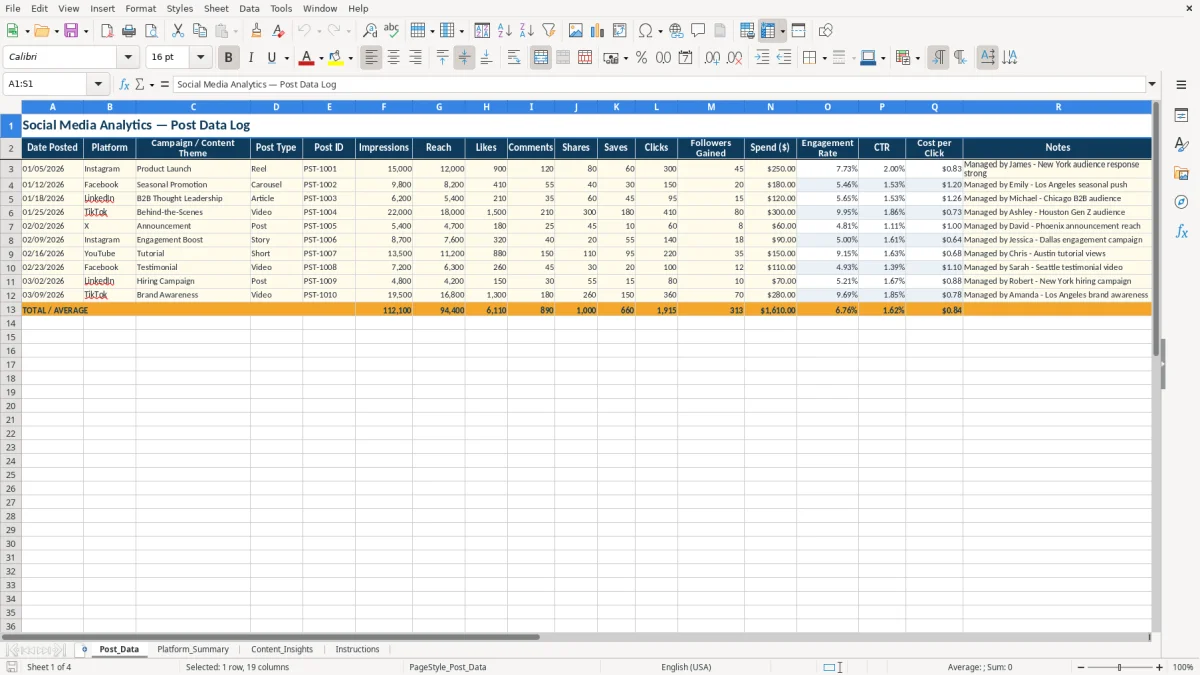
This social media analytics workbook records each post's date, platform, theme, type, reach, impressions, interactions, clicks, followers gained, and spend. It calculates engagement rate, CTR, cost per click, and performance flags, then summarizes results by platform and post type.
Use Post_Data for manual entry, Platform_Summary for totals and comparisons, and Content_Insights for post-type analysis. The workbook includes ten sample post rows, six supported platforms, four charts, and an Instructions tab explaining the calculations and update cadence.
A small-business owner, freelance social media manager, nonprofit communications lead, or creator can use this workbook when a monthly platform report is not enough. It gives you a row for each published post and preserves the connection between a campaign theme, post type, audience response, traffic, and spend.
Suppose your January log contains the ten sample rows already prepared in Post_Data. You can identify whether a Product Launch Reel, Seasonal Promotion Carousel, or B2B Thought Leadership Article produced the stronger combination of engagement and clicks instead of judging performance from likes alone. The sample rows include dates such as 01/05/2026 and platforms including Instagram, Facebook, and LinkedIn.
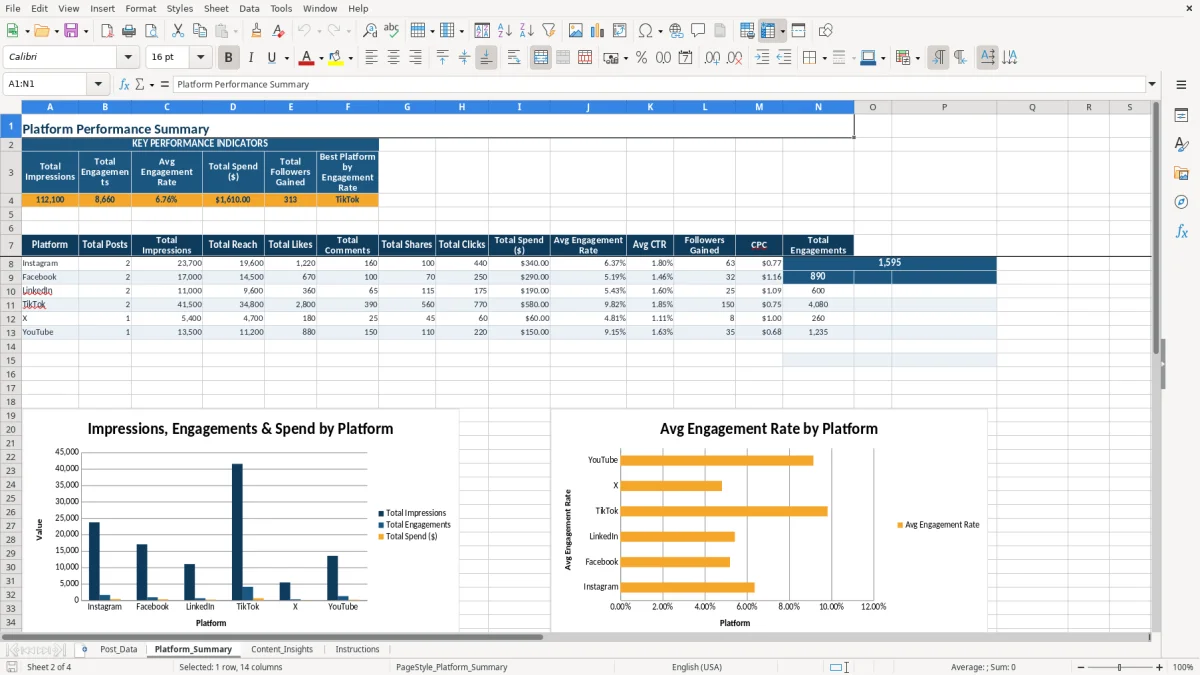
This matters when a marketing coordinator prepares a weekly status meeting or when an agency reports to a U.S. client at month-end. The Platform_Summary tab turns the same post entries into totals for impressions, engagements, spend, and followers gained, so you do not have to copy figures into a second report.
A solo creator can enter metrics after each post, while a two-person marketing team can assign the notes field to capture audience or campaign context. The workbook is especially useful when you manage several channels but do not need a live dashboard or platform integration.
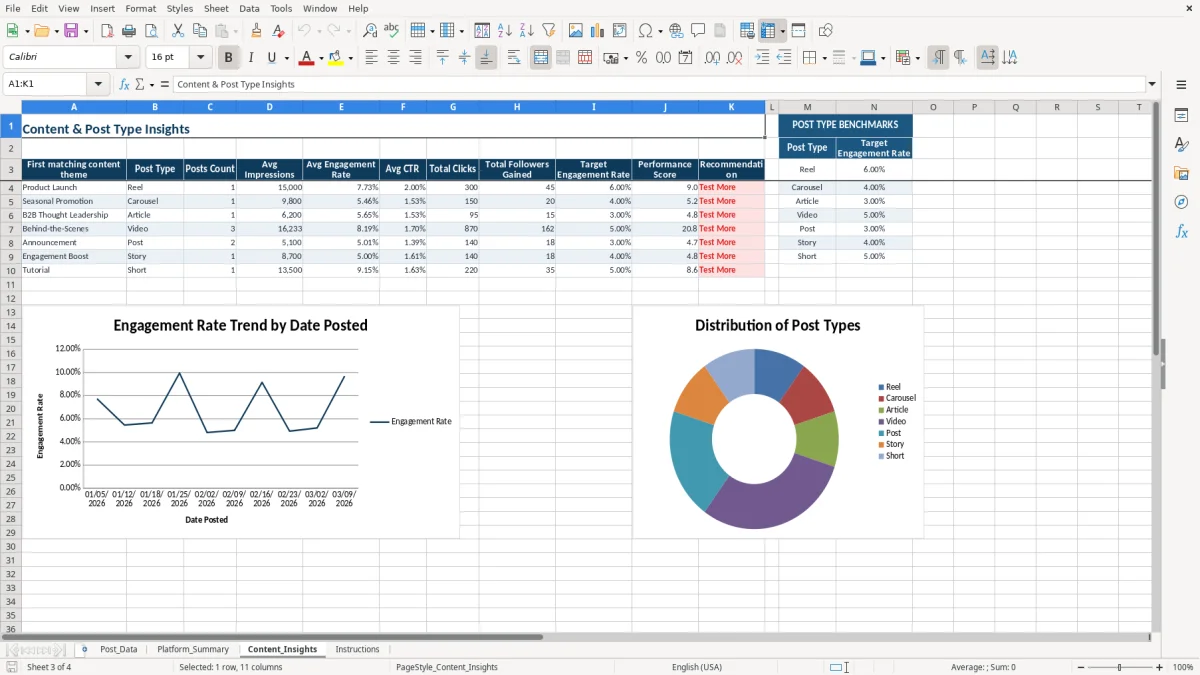
Use the Content_Insights tab when your decision concerns format rather than channel. Reel, Carousel, Article, Video, Post, Story, and Short each have a prepared row, allowing you to compare average impressions, engagement rate, CTR, clicks, and followers gained across the post types represented in the log.
The workbook uses the raw metrics you enter; it does not retrieve data from Instagram, Facebook, LinkedIn, TikTok, X, or YouTube. In Post_Data, Engagement Rate is calculated as (Likes + Comments + Shares + Saves) / Impressions, CTR is Clicks / Impressions, and CPC is Spend / Clicks.
The first sample post has 15,000 impressions, 900 likes, 120 comments, 80 shares, and 60 saves. Its engagement calculation is (900 + 120 + 80 + 60) / 15,000, or 7.73%. Its 300 clicks produce a 2.00% CTR, and $250 of spend divided by 300 clicks produces a $0.83 CPC when rounded to cents.
These are workbook calculations, not universal marketing benchmarks. The Performance Flag uses a 5% engagement-rate threshold: a row at or above that level displays Strong; a row below it displays Needs Review. The threshold is an illustrative heuristic and should not be presented as a platform standard.
Platform_Summary uses SUMIF and COUNTIF to total values for each named platform and AVERAGEIF to calculate average rates. Its Best Platform by Engagement Rate result uses INDEX and MATCH to return the platform with the highest average engagement rate in the listed comparison range.
Content_Insights uses the post type as the grouping field. Its theme column returns the first matching content theme, so it is not a complete theme grouping. The target engagement rates in the benchmark block, the Performance Score, and the Scale or Test More recommendation are illustrative values built into the workbook.
Most reporting problems begin before the formulas run. If one person types Instagram and another types Instagram with an extra space or different spelling, platform totals can fail to match the source rows. The dropdown in Post_Data column B prevents that particular drift for the six listed platforms, but it does not validate every other field.
Do not enter reach in the impressions column or combine paid and organic results without noting the distinction. A post with 15,000 impressions and 12,000 reach tells a different story from a post with 12,000 impressions and 15,000 reach, which is not a logical entry. Check the source platform report before typing each metric.
Spend creates another frequent error. The sample Instagram Reel uses $250 and 300 clicks, giving a CPC of about $0.83. If you enter 250 as clicks and 300 as spend, the workbook will still calculate a number, but that number will describe reversed inputs rather than campaign efficiency.
Overwriting Engagement Rate, CTR, Cost per Click, or Performance Flag breaks the row's calculation. A blank or zero denominator is handled with IFERROR, so a zero result may mean that impressions or clicks have not been entered yet; it does not mean the post performed at zero.
Another reporting trap is treating the Content_Insights score as a verified industry ranking. The score combines engagement rate, CTR, and followers gained with fixed weights, and the recommendation changes at 80. Use it to create a consistent internal comparison, not as proof that one format will perform the same way on every platform.
Make the workbook part of the publishing workflow instead of waiting for the end of the month. After a post has accumulated its reporting metrics, add its row to Post_Data during the same weekly review when you check campaign links, comments, and follower movement.
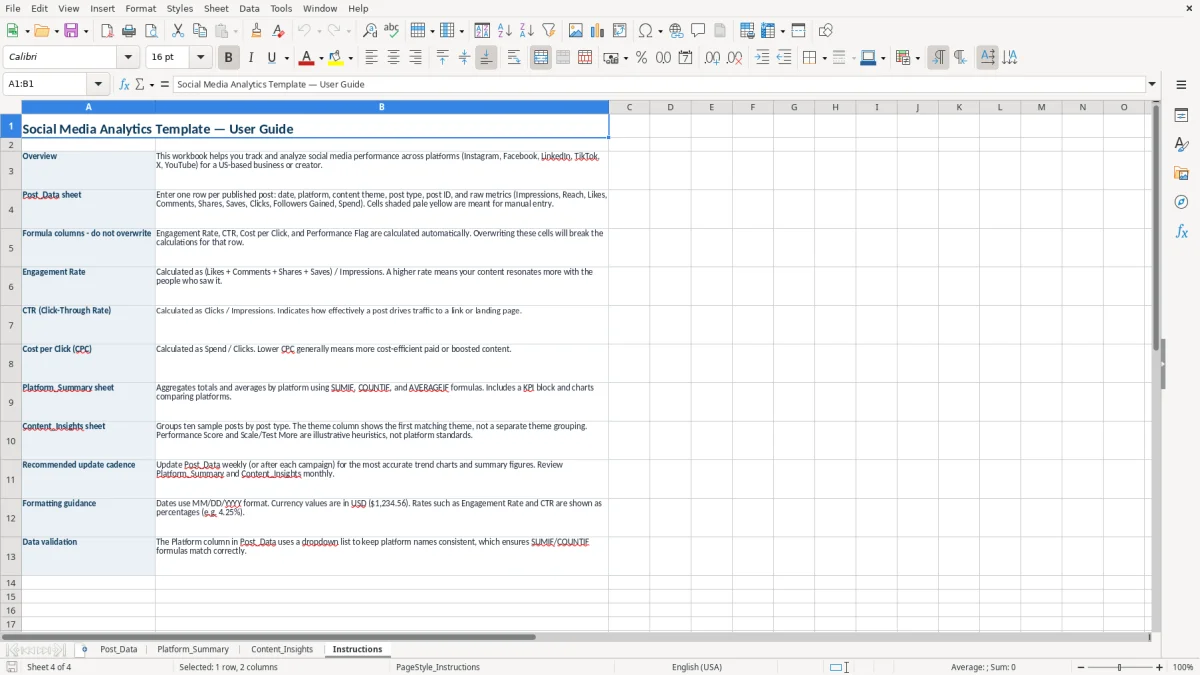
The Instructions tab recommends updating weekly or after each campaign and reviewing the two analysis tabs monthly. That cadence is practical because the workbook's formulas summarize the prepared range of ten sample post rows; it is not a live warehouse or an automatic feed.
Use MM/DD/YYYY dates, enter spend as U.S. dollars, and keep post-type labels aligned with the prepared categories: Reel, Carousel, Article, Video, Post, Story, and Short. Record campaign context in Campaign / Content Theme and use Notes for ownership or audience observations rather than changing the calculation columns.
When your reporting process requires more than the workbook's prepared rows, multiple contributors, automated imports, or historical data management, move to a dedicated social reporting platform or a controlled database. Until then, this XLSX workbook is best used as a focused manual log and review sheet, with the illustrative thresholds and scores clearly labeled in your internal reports.
Post_Data tracks date, platform, campaign or content theme, post type, post ID, impressions, reach, likes, comments, shares, saves, clicks, followers gained, spend, notes, and calculated performance fields.
The platform dropdown includes Instagram, Facebook, LinkedIn, TikTok, X, and YouTube. Platform_Summary contains a prepared comparison row for each of these six platforms.
Engagement Rate equals (Likes + Comments + Shares + Saves) divided by Impressions. For example, the first sample row calculates (900 + 120 + 80 + 60) / 15,000, or 7.73%.
No. All post metrics are entered manually. The workbook is an XLSX file with formulas, charts, a platform dropdown, sample rows, and instructions, but it has no live data feed or platform integration.
No. The post-type target rates, Performance Score, Scale or Test More recommendation, and 5% Performance Flag threshold are illustrative heuristics included for internal comparison. They are not universal platform benchmarks.