Case Tracker Excel – Free Template (2026)
4
Free download
Evaluate project investment cost, benefits, ROI, payback, profit, status, department codes, KPIs, and charts in an XLSX workbook.


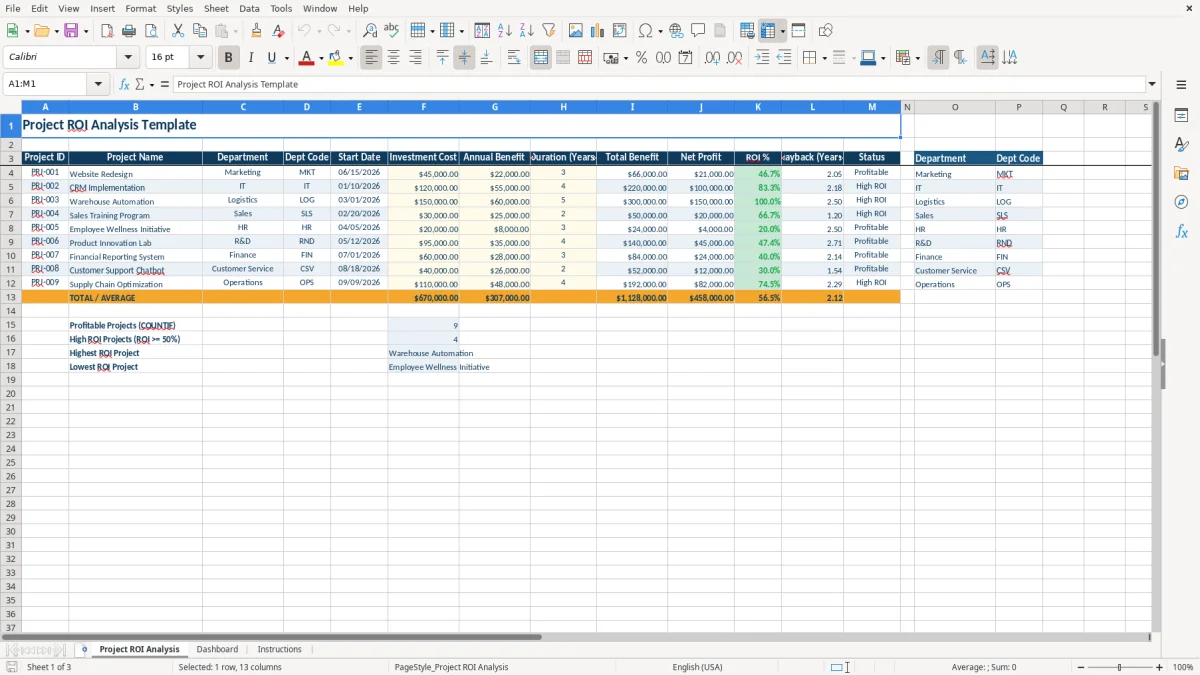
A project ROI Excel workbook compares investment cost with projected annual benefit over a defined duration. This XLSX template contains a Project ROI Analysis tab for project inputs and calculated results, a Dashboard tab for summary KPIs and charts, and an Instructions tab explaining the formulas.
Enter a project ID, name, department, start date, investment cost, annual benefit, and duration in the yellow input cells on Project ROI Analysis. The workbook calculates total benefit, net profit, ROI %, payback in years, status, and department code, then carries the results to the Dashboard.
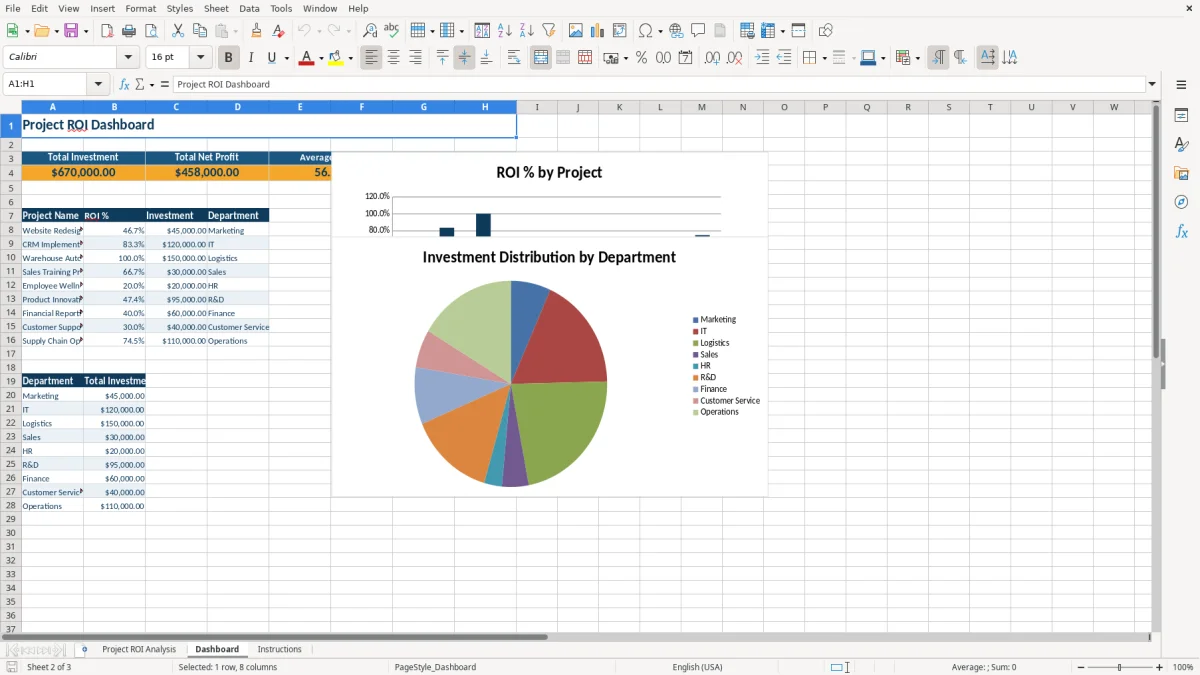
A project ROI spreadsheet is useful when a U.S. business must compare competing investments before approving a budget. A finance manager may review a CRM implementation, a warehouse manager may assess automation, and a marketing director may compare a website redesign with a sales training program. The workbook keeps those decisions in one analysis grid rather than scattered across email and presentation slides.
The Project ROI Analysis tab includes fields for department, start date, investment cost, annual benefit, and duration. In the populated examples, Website Redesign carries a $45,000 investment, $22,000 annual benefit, and 3-year duration; CRM Implementation carries $120,000, $55,000, and 4 years. Those inputs produce comparable outputs even though the projects serve different departments.
A controller can use the rows during an annual planning cycle, a quarterly budget review, or a project approval meeting. The formulas calculate Total Benefit, Net Profit, ROI %, and Payback (Years), while the Status field labels results as High ROI at 50% or more, Profitable at 0% or more, or Loss below 0%.
The Dashboard is useful when the audience does not need every input column. Image 2 shows KPI cards for Total Investment, Total Net Profit, Average ROI %, and Profitable Projects, followed by a project comparison table. Image 1 shows the underlying analysis grid where the assumptions are entered and checked.
Use the workbook for preliminary financial comparison, not as a replacement for a full discounted-cash-flow model. It uses annual benefit and duration, so it does not model monthly timing, financing costs, taxes, depreciation, or changing benefit amounts.
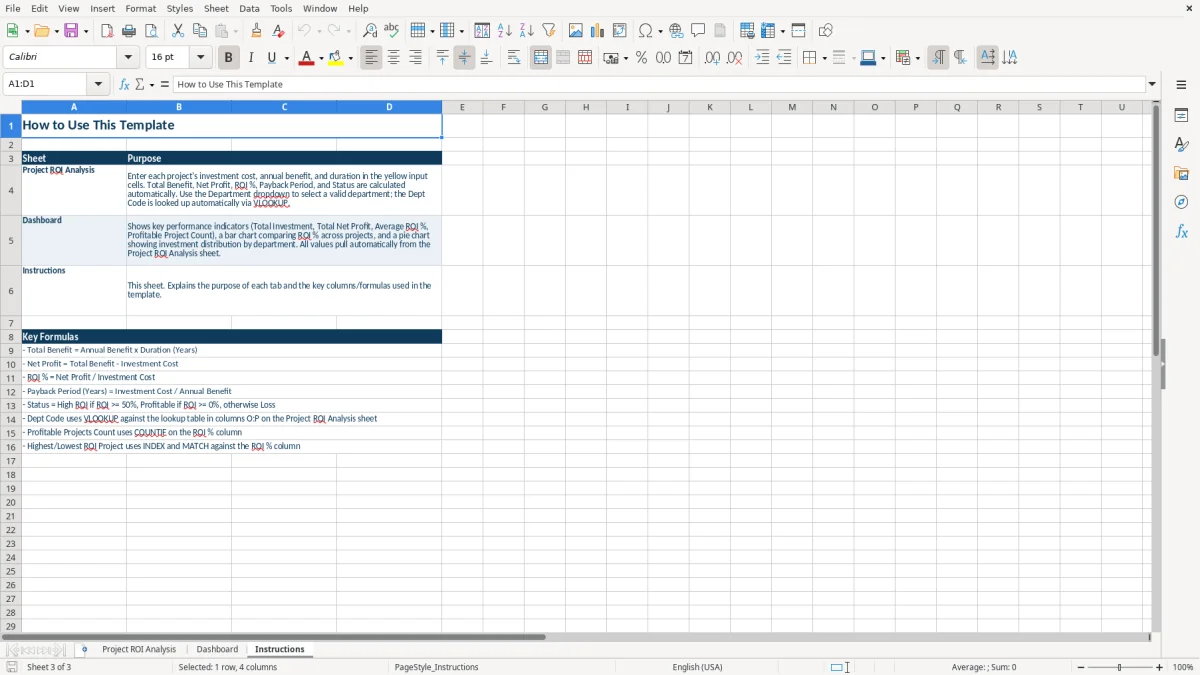
The workbook uses a straightforward ROI calculation that is easy to audit. Total Benefit equals Annual Benefit multiplied by Duration (Years); Net Profit equals Total Benefit minus Investment Cost; ROI % equals Net Profit divided by Investment Cost; and Payback (Years) equals Investment Cost divided by Annual Benefit.
For Website Redesign, the visible inputs are $45,000 of Investment Cost, $22,000 of Annual Benefit, and 3 years. The calculation is $22,000 × 3 = $66,000 Total Benefit, then $66,000 − $45,000 = $21,000 Net Profit. ROI is $21,000 ÷ $45,000 = 46.7%, and payback is $45,000 ÷ $22,000 = 2.0 years.
Status is assigned with an IF formula: ROI of at least 50% returns High ROI, ROI from 0% through 49.9% returns Profitable, and a negative ROI returns Loss. The department code uses VLOOKUP against the visible lookup list in O4:P12; selecting Marketing returns MKT, while selecting Logistics returns LOG.
The Instructions tab, shown as image 3, documents these formulas and explains that the Dashboard's profitable-project count uses COUNTIF. It also identifies INDEX and MATCH as the method used for highest and lowest ROI project references.
These are simple return calculations rather than an IRS or GAAP measurement. Treat the annual benefit as a management estimate, document how you calculated it, and avoid presenting the result as a guaranteed cash return. If benefits occur unevenly over several years, the workbook's annual model will not show that timing difference.
The most expensive error in ROI analysis is entering an optimistic annual benefit without defining what it represents. A $100,000 system with a claimed $40,000 annual benefit shows $120,000 of Total Benefit over 3 years and $20,000 of Net Profit. If the actual annual benefit is $25,000, the same row produces only $75,000 of Total Benefit and a $25,000 loss.
Investment Cost should represent the project cost being compared, while Annual Benefit should represent a recurring yearly benefit. Putting a three-year total benefit into Annual Benefit multiplies the estimate again. For example, entering $66,000 as annual benefit for the Website Redesign would turn the workbook's $66,000 expected total into $198,000.
Payback is calculated as Investment Cost divided by Annual Benefit. It does not account for cash received after the first year, maintenance costs, discount rates, or partial-year launch timing. A $150,000 project with a $60,000 annual benefit shows a 2.5-year payback, but that figure is only meaningful if the benefit begins and continues as assumed.
Another problem is changing a department name without using the dropdown. VLOOKUP returns a blank Dept Code when the text does not exactly match the lookup list. That can make a valid project appear incomplete on a management report even though its financial formulas still calculate.
Finally, do not treat Status as an approval rule. The 50% High ROI threshold is a workbook classification, not a universal business standard. A lower-return project may still be required for compliance or operations, while a high-return estimate may carry substantial execution risk.
Use the workbook at a fixed point in your planning cycle rather than only when someone requests a presentation. A practical routine is to update project assumptions before the monthly finance meeting, review the Dashboard afterward, and save a dated copy before changing estimates.
Keep department entries consistent by using the existing dropdown in C4:C12. Do not overwrite calculated columns D and I:M unless you intend to rebuild the formulas. The lookup table in O:P is visible so you can verify why a department code appears or remains blank.
For a small portfolio, the workbook is appropriate for a recurring spreadsheet review. It has 9 prepared project analysis rows and Dashboard references for the listed rows; it is not an unlimited project database. If your organization needs hundreds of projects, user permissions, audit history, actual-versus-budget tracking, or monthly cash flows, move the process to a project portfolio or accounting system.
Keep the Instructions tab with every saved copy. It gives the next reviewer the formula definitions, including the 50% High ROI classification, so a future reader can distinguish the workbook's calculation rules from the business assumptions entered by your team.
It calculates Total Benefit, Net Profit, ROI %, Payback (Years), and Status from Investment Cost, Annual Benefit, and Duration (Years). It also assigns a department code from the selected department.
The workbook contains Project ROI Analysis, Dashboard, and Instructions. The first tab contains inputs and calculations, the second summarizes results with KPIs and charts, and the third explains the workbook.
ROI % equals Net Profit divided by Investment Cost. Net Profit equals Total Benefit minus Investment Cost, and Total Benefit equals Annual Benefit multiplied by Duration (Years).
The workbook returns High ROI when ROI is at least 50%. It returns Profitable when ROI is at least 0% but below 50%, and Loss when ROI is negative.
The Dept Code uses VLOOKUP and requires an exact department name from the dropdown list. Select a department in C4:C12 instead of typing a variation or abbreviation.
No. The workbook uses annual benefit and duration, so it does not calculate monthly timing, financing costs, taxes, depreciation, or discounted cash flow. Use it for an initial project comparison.