Case Tracker Excel – Free Template (2026)
4
Free download
Track tasks, milestones, owners, dates, budgets, completion, status, and project KPIs in an XLSX workbook for team planning.


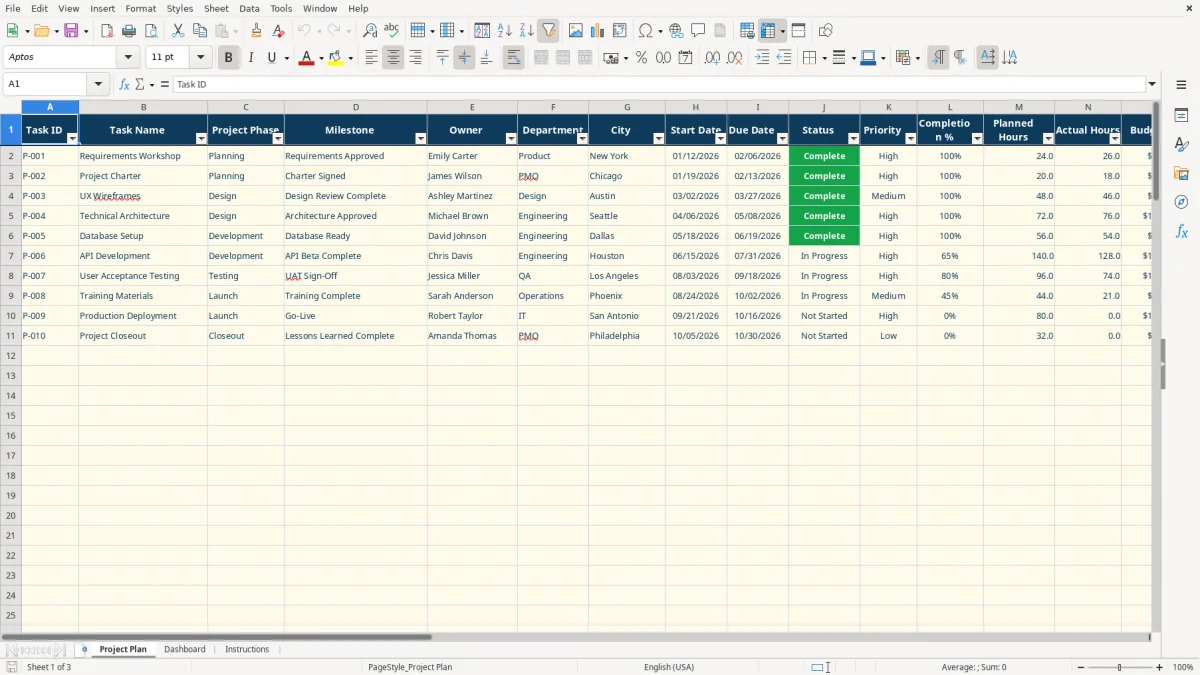
This project plan with milestones workbook organizes tasks, owners, phases, dates, budgets, completion percentages, and milestone status in Excel. It includes a detailed Project Plan tab, a formula-driven Dashboard with project KPIs and charts, and an Instructions tab for setup.
Use the prepared rows for your own work instead of rebuilding a schedule from scratch. The workbook separates editable project details from calculated fields such as variance, days remaining, and On Track? results.
A project coordinator can use the Project Plan tab during a weekly delivery meeting, while an office manager can maintain it between meetings as owners report progress. The fields are suited to work that needs more than a simple task list: each row connects a task to a project phase, milestone, owner, department, city, dates, hours, and cost.
Product, PMO, design, development, testing, launch, and closeout work can share one schedule. The sample rows show this structure clearly: Requirements Workshop is assigned to Product in New York, Project Charter belongs to PMO in Chicago, and UX Wireframes belongs to Design in Austin. Replace those populated examples with your actual assignments.
Before a status meeting, update Completion %, Status, Actual Hours, Actual Cost, and Notes. A task with a $6,800 budget and $6,500 actual cost produces a negative $300 variance, while a task with a $4,800 budget and $5,100 actual cost produces a positive $300 variance. That makes cost conversations specific instead of relying on general progress comments.
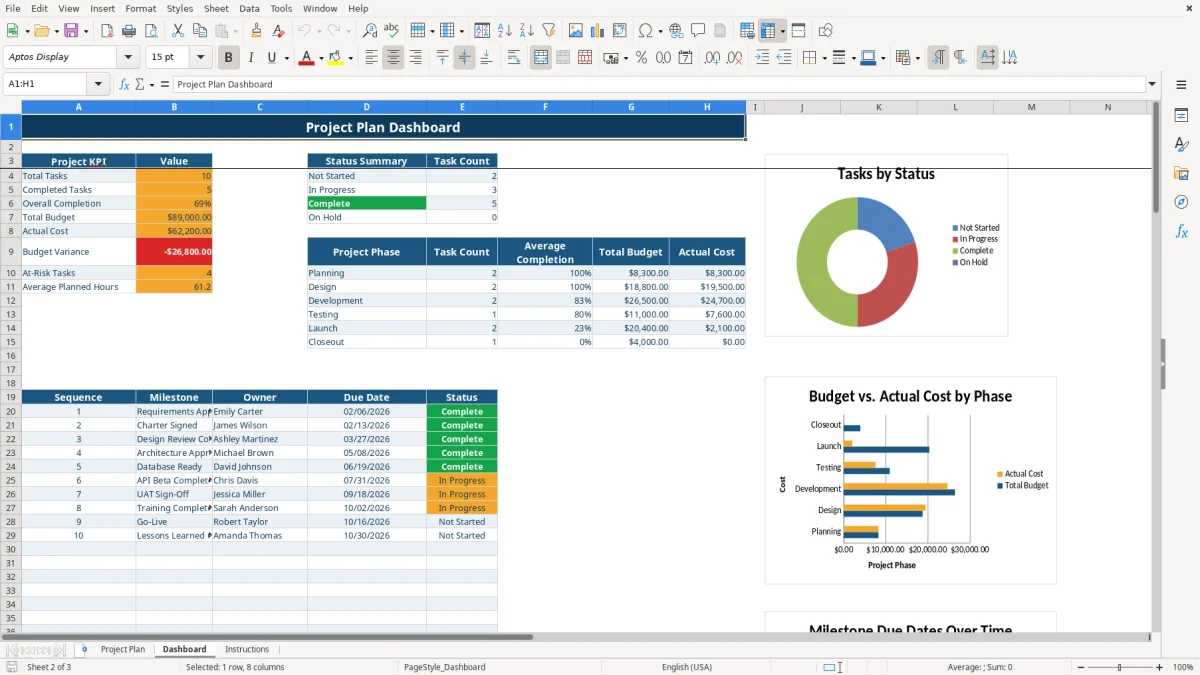
The Dashboard is useful when a sponsor wants a short summary rather than the full task register. It counts tasks by status, summarizes six project phases, and lists milestone sequence, owner, due date, and status for a quick review.
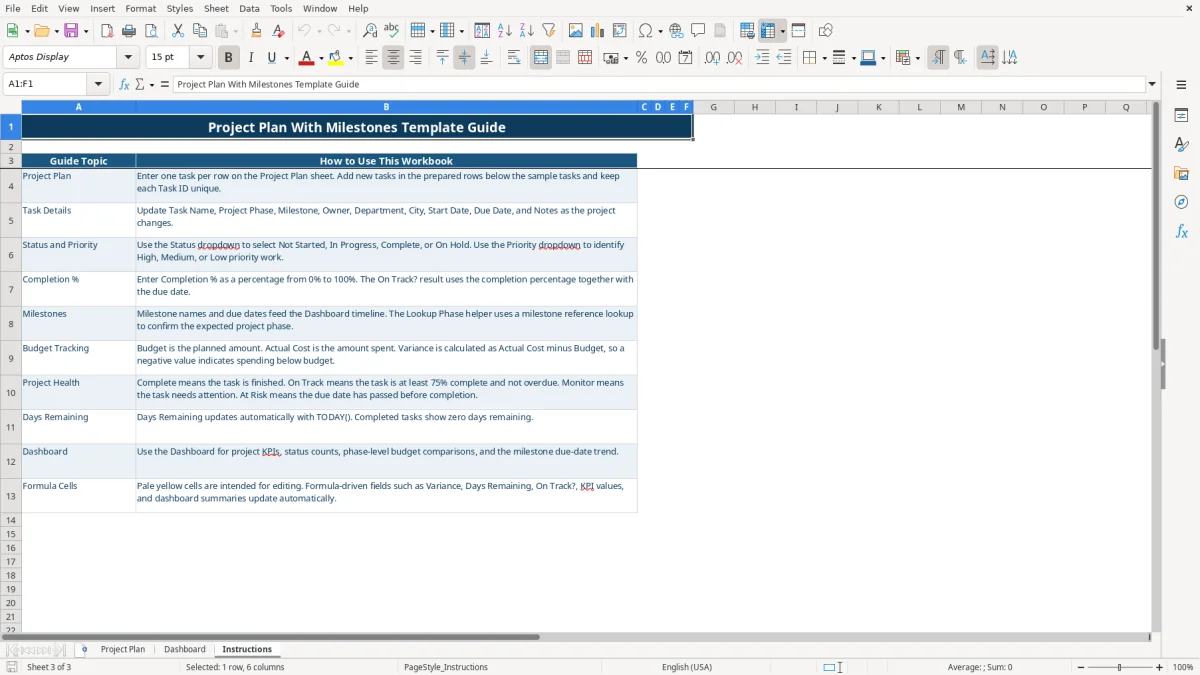
The workbook distinguishes information you enter from results Excel calculates. On the Project Plan tab, you enter the dates, status, Completion %, budget, and actual cost. Formula columns calculate Variance, Days Remaining, On Track?, and Lookup Phase across the prepared rows from row 2 through row 101.
Days Remaining compares Due Date with TODAY(). A completed task displays zero days remaining. For an unfinished task, a past due date returns a negative number, which supports an At Risk result; a future task is On Track when Completion % is at least 75%, and otherwise returns Monitor.
Variance is calculated as Actual Cost minus Budget. In the sample data, the $5,100 actual cost against a $4,800 budget gives $300, while $3,200 against a $3,500 budget gives -$300. On the Dashboard, SUM, COUNTIF, SUMIF, and AVERAGE formulas summarize totals, status counts, phase budgets, actual costs, and completion.
The Milestone reference area maps milestone names to expected phases through a VLOOKUP-based helper. Keep milestone names consistent when editing them; a spelling difference can produce Not Found in the Lookup Phase field. The workbook is provided in XLSX format, and formulas should be checked if you open it in software with different Excel-function support.
The most damaging project-plan error is leaving the source fields stale while trusting the Dashboard. If a task remains marked Complete after its scope changes, the Dashboard still counts it as complete and Days Remaining still shows zero. That can make a delayed deliverable look finished during a sponsor review.
Phase and milestone text drives the workbook's summaries and lookup. Typing Development in one row and Developement in another separates the work from the intended phase; changing Requirements Approved to Requirements approval can cause the Lookup Phase helper to return Not Found. Use the existing wording when a task belongs to one of the six sample phases.
Entering $650 instead of $6,500 changes a sample task's apparent variance from -$300 to -$6,150. Likewise, entering 75 rather than 75% makes Completion % exceed the intended 0% to 100% range. These are not cosmetic mistakes: they alter phase averages and can change a task from On Track to Monitor.
Another breakdown occurs when a due date is missing. Days Remaining and On Track? depend on Due Date, so an incomplete date leaves the health view incomplete. Review editable yellow cells before each meeting, then compare the Dashboard totals with the task rows rather than treating the summary as a substitute for source data.
Set one recurring update time before the project meeting, such as the afternoon before a Friday review. Owners can provide current Status, Completion %, Actual Hours, Actual Cost, and Notes, while the coordinator verifies dates and milestone names. With 10 active tasks, a short row-by-row review is more reliable than waiting until several due dates have passed.
Do not overwrite formula-driven columns when entering routine updates. Keep the prepared row structure, use the dropdown values exactly as provided, and preserve the existing milestone wording where the reference lookup is used. The Instructions tab explains that pale yellow cells are intended for editing.
This workbook is a practical fit when one team needs a shared XLSX register and a concise dashboard. Consider a dedicated project-management system when you need permissions, comments, automated notifications, dependency management, or simultaneous workflow controls that this file does not provide.
The XLSX workbook contains Project Plan, Dashboard, and Instructions tabs. The Project Plan tab tracks tasks, milestones, owners, dates, progress, hours, budgets, actual costs, and notes; the Dashboard summarizes project performance with formulas and three charts.
Enter Task ID, Task Name, Project Phase, Milestone, Owner, Department, City, Start Date, Due Date, Status, Priority, Completion %, Planned Hours, Actual Hours, Budget, Actual Cost, and Notes. Variance, Days Remaining, On Track?, Lookup Phase, and Dashboard summaries are calculated.
A completed task returns Complete. An unfinished task with a past due date returns At Risk; an unfinished task with Completion % of at least 75% returns On Track; other unfinished tasks return Monitor.
Variance equals Actual Cost minus Budget. For example, a $5,100 actual cost against a $4,800 budget produces a $300 variance, while $3,200 against $3,500 produces -$300.
Yes. The Project Plan tab has prepared operational rows through row 101. Add one task per row, keep each Task ID unique, and preserve the existing formula columns so calculated results continue to update.