Case Tracker Excel – Free Template (2026)
4
Free download
Track regular and overtime hours, labor cost, employee totals, and daily trends with an XLSX labor histogram workbook for managers.


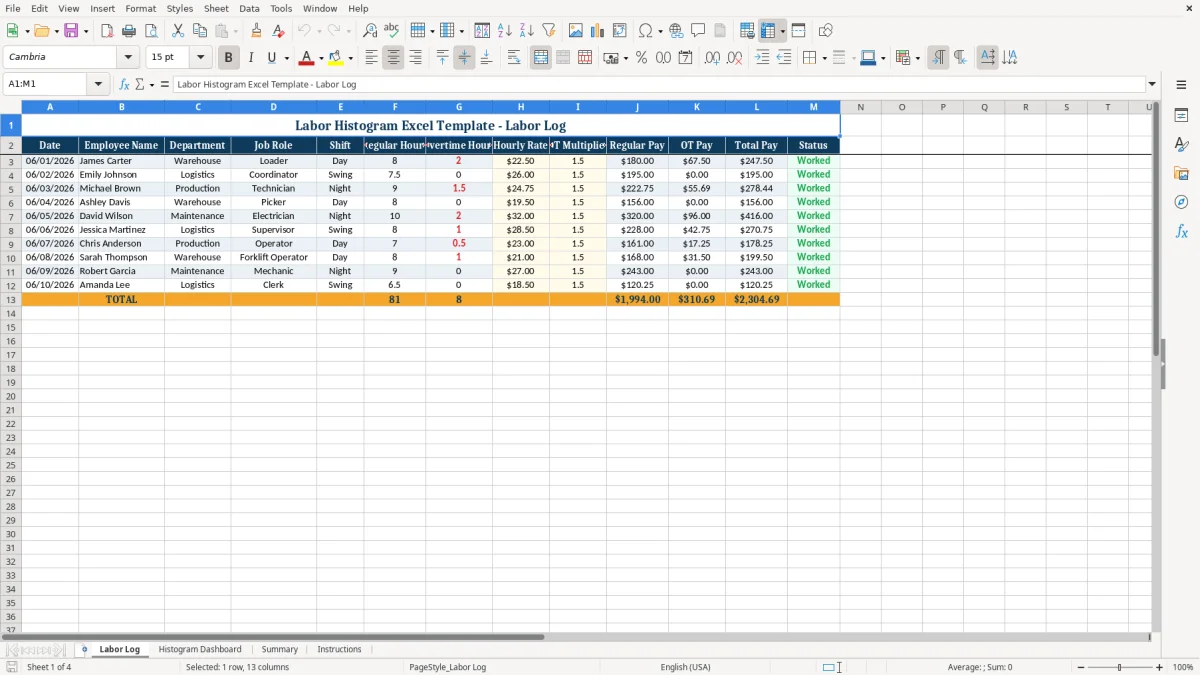
A labor histogram workbook records employee shifts, separates regular and overtime hours, calculates pay, and summarizes staffing patterns. It includes a Labor Log, a Histogram Dashboard with four charts, an employee Summary, and an Instructions tab.
Use the Labor Log to enter dates, employees, departments, job roles, shifts, hours, hourly rates, and OT multipliers. The workbook calculates regular pay, overtime pay, total pay, and work status, then links those results to management summaries.
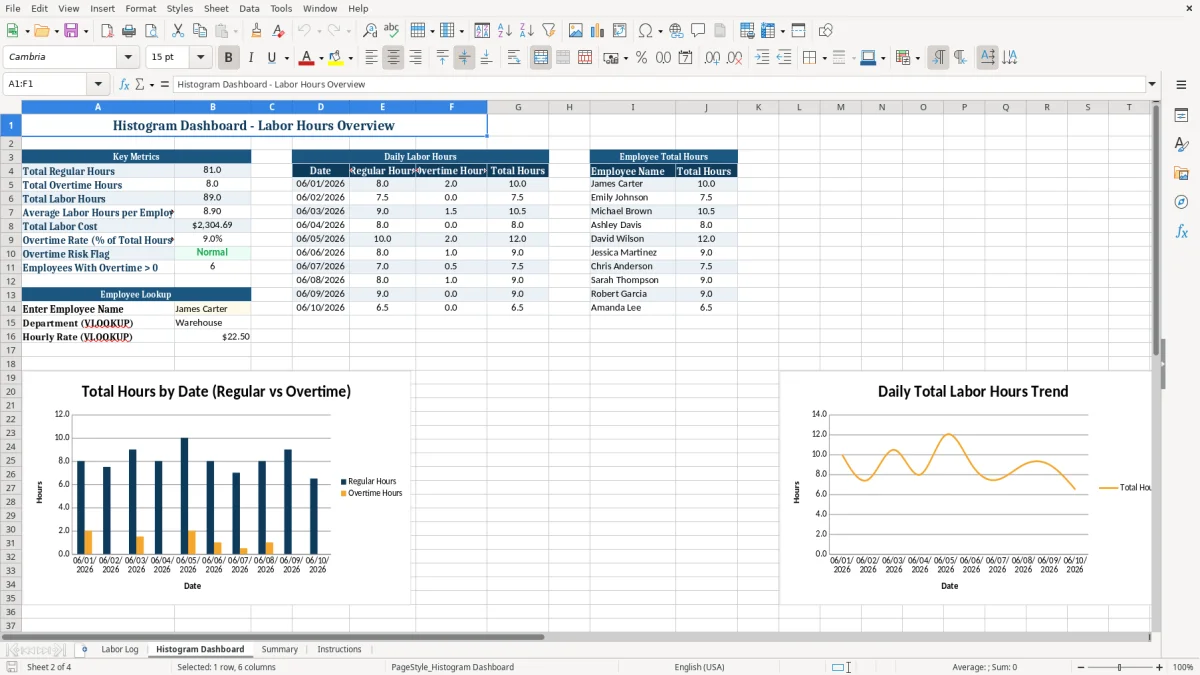
A labor histogram workbook is useful when an office manager, warehouse supervisor, production lead, or project coordinator needs to see staffing intensity rather than only a payroll total. The Labor Log records one employee shift per row, including the date, department, job role, shift, regular hours, overtime hours, hourly rate, and OT multiplier.
A warehouse manager can compare Day, Swing, and Night shifts while watching whether overtime is concentrated in Warehouse, Logistics, or Production. The sample rows include James Carter in Warehouse with 8 regular hours and 2 overtime hours, while Emily Johnson has 7.5 regular hours and no overtime in Logistics.
That distinction matters during a weekly staffing review. A payroll total may show labor cost, but the daily chart separates regular and overtime hours by date, making a heavy overtime day easier to identify.
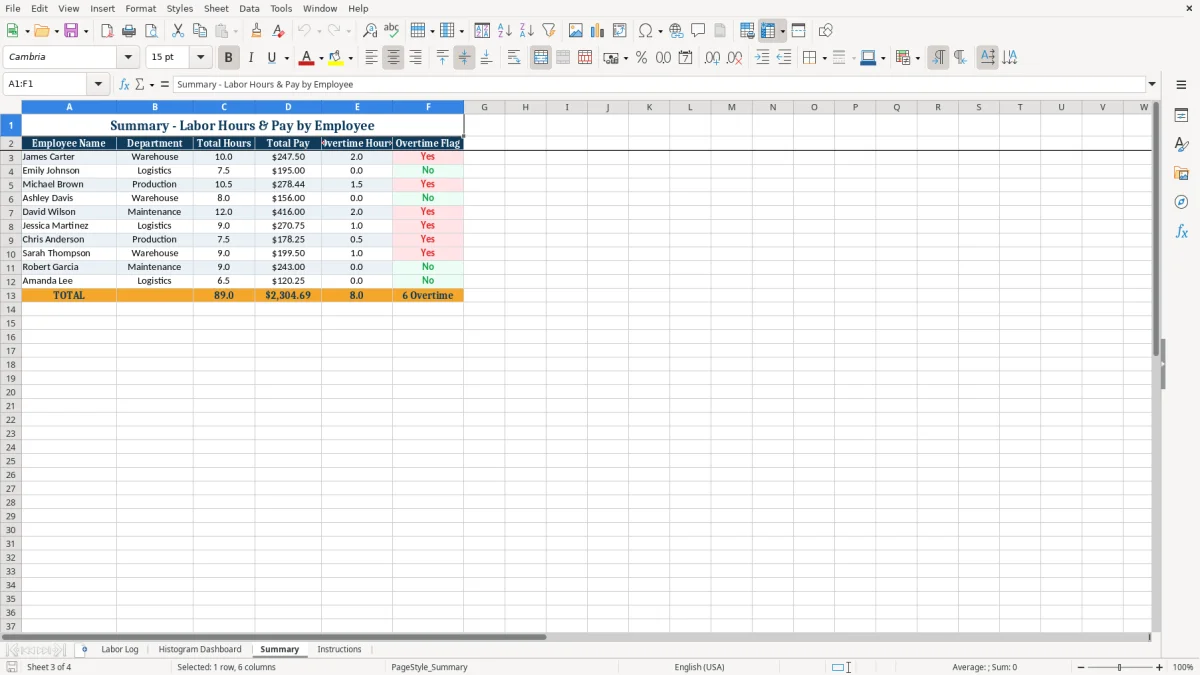
An office manager can update the log before a payroll run, verify the calculated Total Pay column, and then use Summary to review each employee. The Summary tab shows total hours, total pay, overtime hours, and an overtime flag for the listed employees.
The workbook is populated with sample employees and prepared rows rather than an unlimited data-entry system. Keep the reporting period consistent with the workbook instruction to use 2026 dates, and review the formulas after making structural changes.
The workbook uses straightforward Excel formulas to turn entered shift data into labor measures. On Labor Log, Regular Pay equals Regular Hours multiplied by Hourly Rate. OT Pay equals Overtime Hours multiplied by Hourly Rate and OT Multiplier, while Total Pay adds those two amounts.
For the sample James Carter row, 8 regular hours at $22.50 produces $180.00 of regular pay. Two overtime hours at the same rate and a 1.5 multiplier produce $67.50 of OT pay, for $247.50 total pay.
The Status formula returns No Hours when both regular and overtime hours are zero or when total pay is zero. Otherwise, it returns Worked. This is an operational check on the row, not a payroll compliance determination.
Histogram Dashboard uses SUM formulas for regular, overtime, and total hours and calculates average labor hours per employee. Its employee lookup uses VLOOKUP to return department and hourly rate from the Labor Log.
Summary uses VLOOKUP for department and SUMIF for total hours, total pay, and overtime hours. The overtime flag returns Yes when the employee has overtime above zero and No otherwise. Rates and multipliers are editable workbook inputs, so update them when your pay policy changes.
The most damaging errors begin in the Labor Log, before anyone opens the charts. Entering overtime hours in Regular Hours understates the overtime picture, while entering a regular shift as overtime inflates both the OT total and calculated pay.
Using $24.75 instead of $26.00 as an hourly rate changes a 9-hour regular shift by $11.25. A wrong OT Multiplier is also material: 2 overtime hours at $22.50 with a 1.5 multiplier produces $67.50, but a multiplier of 1.0 produces only $45.00.
Do not type over calculated columns J through M on Labor Log. Replacing a formula with a hard-coded amount can leave Total Pay disconnected from the hours and rate that produced it.
A row with no hours is marked No Hours, but an accidentally blank employee name can still make a review harder. Before using the dashboard, check that each populated row has a date, employee name, hours, rate, and multiplier.
The dashboard charts reflect the linked reporting rows. If you place new records outside the prepared ranges, the existing formulas and charts may not include them automatically. Verify the displayed totals after any change to the workbook layout rather than assuming the report expanded.
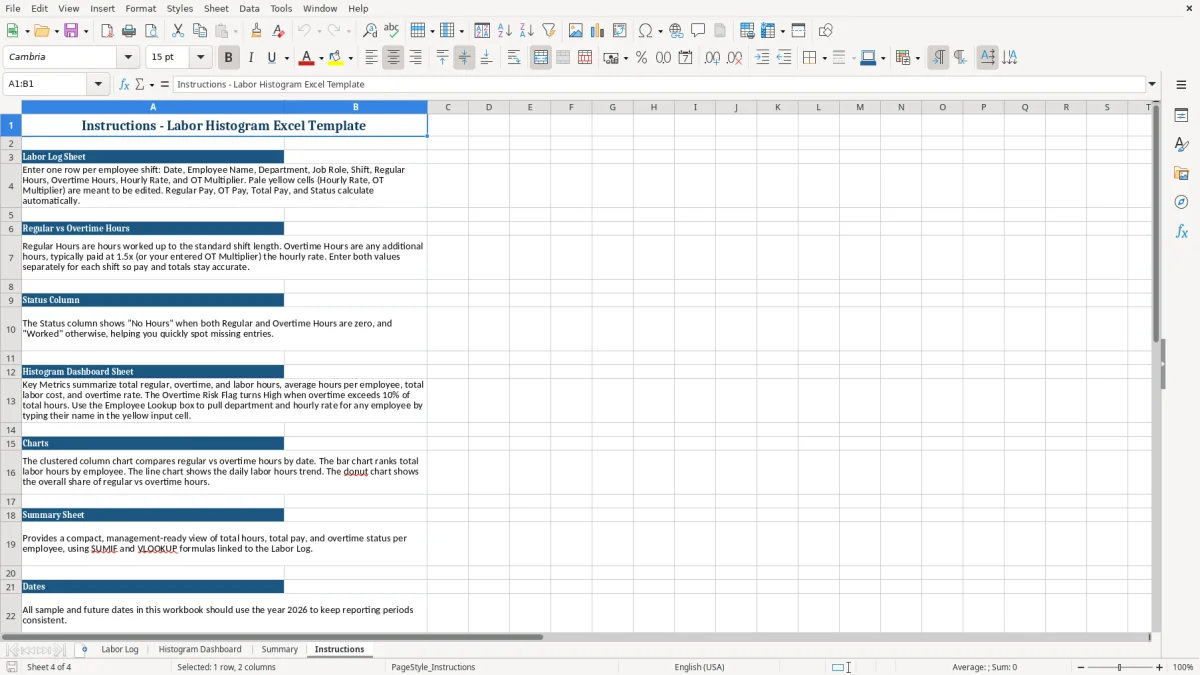
Use a fixed update point, such as the end of the last shift in the reporting week or immediately before payroll review. Enter each shift while the details are available instead of reconstructing a week from memory; the workbook is designed around one row per employee shift.
Use the same spelling for an employee name on every row. Summary relies on matching names through VLOOKUP and SUMIF, so a variation such as James Carter versus James C. can split the results.
Save a dated copy after each completed reporting period, and keep the original sample workbook unchanged as a reference. If your operation outgrows the prepared reporting rows or requires scheduling, time-clock integration, approvals, and audit history, move the process to a payroll or workforce-management system rather than relying on manual expansion.
Labor Log contains Date, Employee Name, Department, Job Role, Shift, Regular Hours, Overtime Hours, Hourly Rate, OT Multiplier, Regular Pay, OT Pay, Total Pay, and Status columns. The first nine are entry fields; the pay and status columns are calculated.
Histogram Dashboard summarizes regular hours, overtime hours, total labor hours, average labor hours per employee, total labor cost, overtime rate, overtime risk, and employees with overtime. It also includes daily and employee-level reporting areas.
OT Pay is calculated as Overtime Hours multiplied by Hourly Rate and OT Multiplier. For example, 2 overtime hours at $22.50 with a 1.5 multiplier equals $67.50.
Status shows No Hours when both Regular Hours and Overtime Hours are zero or Total Pay is zero. It shows Worked when the row contains calculated worked pay.
Yes. Hourly Rate and OT Multiplier are input fields on Labor Log. Review them whenever wage rates or overtime policies change so Regular Pay, OT Pay, and Total Pay remain accurate.
The workbook formulas and charts reference the prepared reporting ranges shown in the file. If you add records outside those ranges or change the layout, verify that the dashboard and Summary formulas include the new data.