Case Tracker Excel – Free Template (2026)
4
Free download
ISO 9001 risk register in XLSX format with scoring matrix, residual-risk calculations, dashboard charts, and instructions for quality teams.


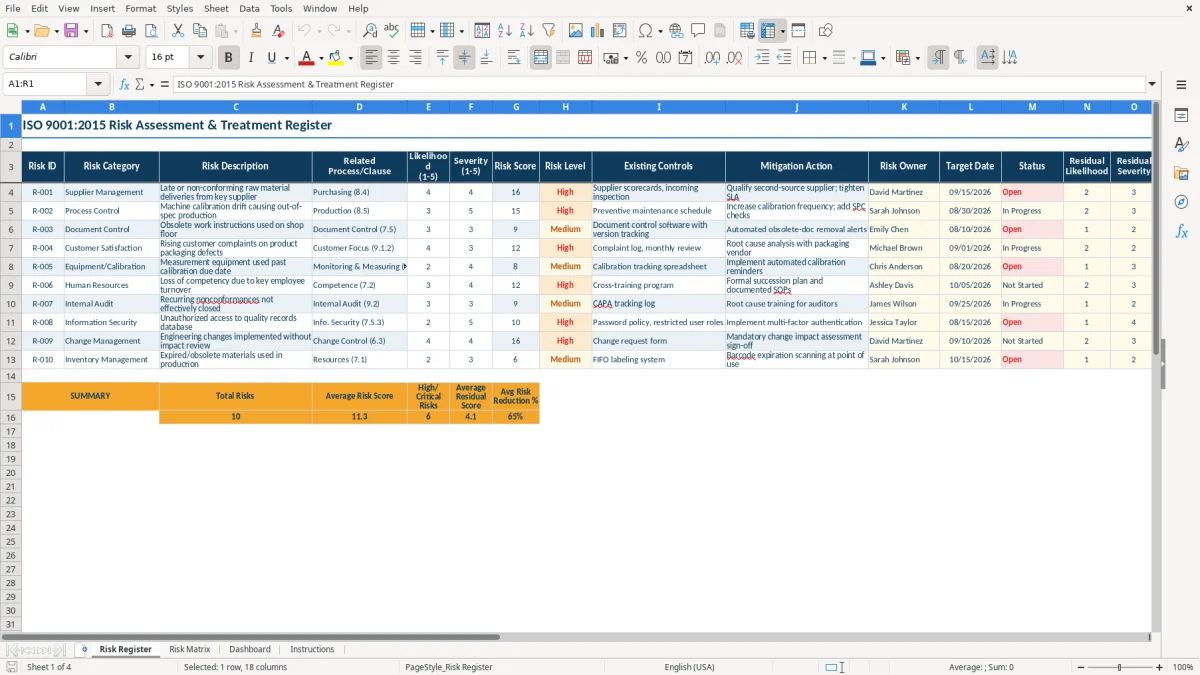
This ISO 9001 risk assessment workbook records quality risks, rates likelihood and severity from 1 to 5, calculates risk scores, assigns risk levels, and tracks mitigation. It contains a Risk Register, Risk Matrix, Dashboard, and Instructions sheet for documenting risks and opportunities under ISO 9001:2015 clause 6.1.
Use the Risk Register to document the process, related clause, existing controls, mitigation action, owner, target date, and status. The workbook also compares initial and residual scores, calculates risk reduction, and summarizes the register on the Dashboard.
A quality manager uses this workbook during management review, internal-audit preparation, process planning, and follow-up after a customer complaint. A small manufacturer can record supplier, production, calibration, document-control, and customer-satisfaction risks in one working register instead of keeping separate notes in each department.
The Risk Register has fields for Risk Category, Risk Description, Related Process/Clause, Existing Controls, Mitigation Action, Risk Owner, Target Date, and Status. That structure gives a process owner a specific action to manage rather than a vague statement that a process is risky. The sample supplier risk is tied to Purchasing (8.4), while the calibration example is tied to Production (8.5).
A company with four core processes might begin with four to ten risks per process. The workbook's sample entries show practical issues such as late raw-material deliveries, calibration drift, and obsolete work instructions. These are populated examples, not a limit on the register; the prepared entry area extends through row 33.
Use the register during a quarterly quality review, after a significant process change, after an audit finding, or when a customer complaint reveals a new failure mode. For example, a production supervisor can change a calibration rating from 3 likelihood and 5 severity to residual ratings of 2 and 3 after adding controls. The workbook then shows the score moving from 15 to 6 and calculates the reduction.
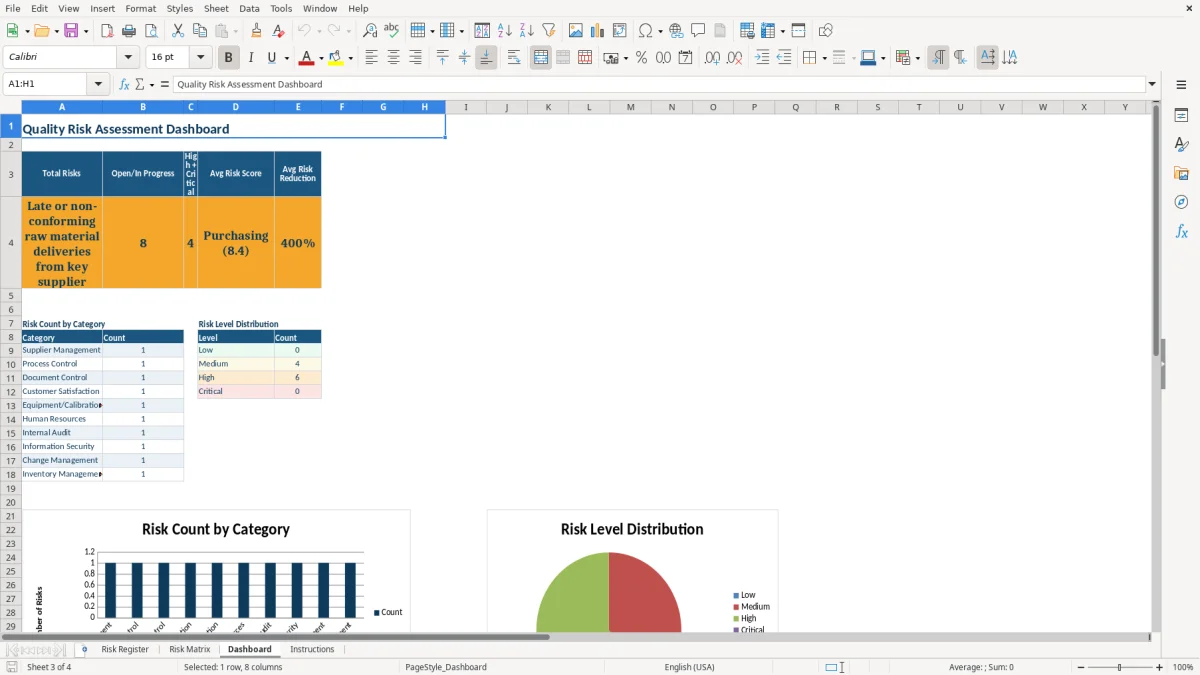
The Dashboard helps management focus on the current workload. It displays total risks, open or in-progress items, high and critical risks, average score, and average risk reduction, followed by category and risk-level summaries.
This workbook is designed around ISO 9001:2015 clause 6.1, which addresses actions to address risks and opportunities within the quality management system. It is a documentation and evaluation aid, not a certification decision or a substitute for your organization's approved risk criteria.
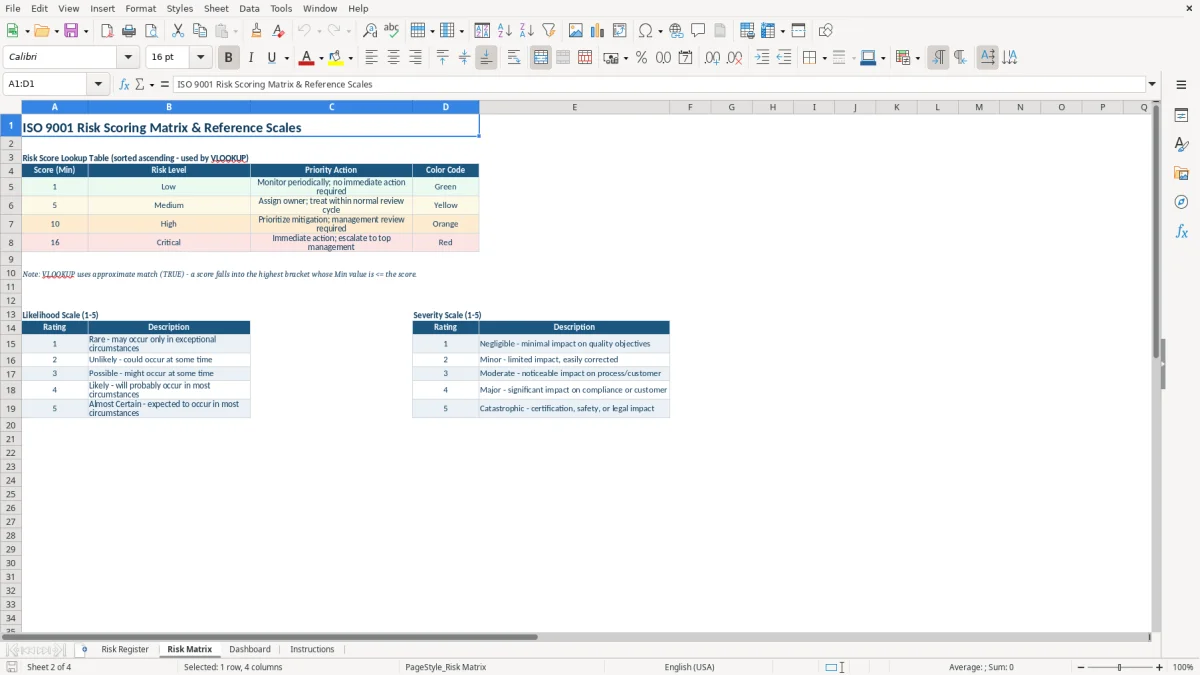
The Risk Matrix defines both Likelihood and Severity on a 1–5 scale. Likelihood runs from Rare to Almost Certain, while severity runs from Negligible to a level described as Major. Entering 4 for likelihood and 4 for severity produces a risk score of 16, which the included lookup table classifies as Critical.
The score thresholds are explicit: 1 begins Low, 5 begins Medium, 10 begins High, and 16 begins Critical. The Risk Register uses approximate-match VLOOKUP against the sorted Score (Min) column. Do not delete or reorder that reference table, because changing its order can change the assigned level.
Initial Risk Score is calculated as Likelihood × Severity. Residual Risk Score uses the same calculation after controls or mitigation actions are considered. A score of 12 reduced to 4 represents a 66.7% reduction, calculated as (12 − 4) ÷ 12.
The workbook validates rating inputs as whole numbers from 1 through 5 and provides dropdowns for Risk Category and Status. Those controls support consistent entries, but they do not verify whether a rating is appropriate. Your quality team must apply the same documented interpretation to comparable risks.
The most damaging failure is recording a risk without recording the decision that follows. A row that says supplier risk but leaves Existing Controls, Mitigation Action, Risk Owner, and Target Date blank cannot show who is responsible or when treatment should occur. It may look complete in a meeting while producing no evidence of follow-through.
Teams often rate every risk as 3 because the middle of the scale feels safe. That turns the score into a formality: 3 × 3 equals 9, which sits below the High threshold of 10 even when the potential consequence deserves urgent attention. Use the descriptions on Risk Matrix to distinguish Rare from Almost Certain and Negligible from Major.
Another error is entering residual ratings before a control is actually implemented. If a risk begins at 16 and someone immediately enters residual values of 1 and 1, the workbook reports 93.8% reduction. That percentage is misleading unless the new control exists, operates, and has been checked.
Do not overwrite formula cells in Risk Score, Risk Level, Residual Score, Residual Level, or Risk Reduction %. A manual value can remain visible while no longer responding to changed ratings. Similarly, changing the Risk Matrix thresholds without documenting the decision can reclassify several risks at once.
Watch the Dashboard for symptoms of bad data. If a category count is unexpectedly zero or the average reduction looks extreme, inspect the underlying rows rather than treating the summary as proof. The Dashboard summarizes the register's current populated range, so incomplete entries can make the picture look better than the operating process.
Make one person responsible for updating the workbook before each quality review. A practical routine is to review new complaints, audit findings, supplier issues, and process changes first, then update the relevant row before the meeting. The Risk Owner should confirm the action and target date rather than leaving the quality manager to maintain every detail.
For example, a team with 10 populated risks can spend 5 minutes on each open item and finish a focused review in about 50 minutes. The Dashboard's category and level charts make it easier to see whether attention is concentrated in suppliers, production, document control, or another category.
Keep the Risk Matrix sheet as the controlled reference for thresholds and rating descriptions. Save a dated copy before a major revision, and record why the scoring approach changed in your quality-system records. The workbook is in XLSX format; practical review and editing depend on the spreadsheet application you use, and chart or formula behavior should be checked after saving changes.
Move to a dedicated quality-management system when you need approval workflows, audit trails, notifications, permissions, or many concurrent editors. This workbook is most effective for a defined team that can maintain one controlled register and review it on a fixed schedule.
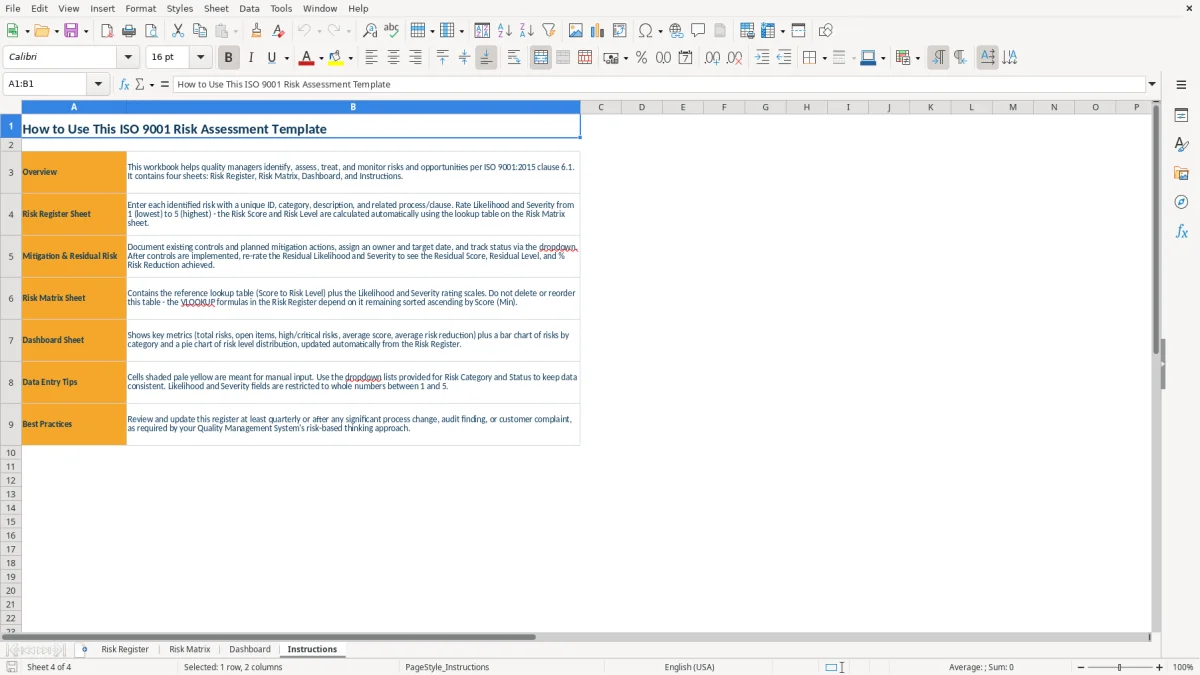
The XLSX workbook contains four tabs: Risk Register, Risk Matrix, Dashboard, and Instructions. It includes risk scoring, residual-risk calculations, mitigation fields, status tracking, summary metrics, and two Dashboard charts.
Enter Likelihood and Severity as whole numbers from 1 to 5. The workbook multiplies them, so a likelihood of 4 and severity of 4 produces a Risk Score of 16.
The Risk Matrix assigns levels using minimum scores: 1 for Low, 5 for Medium, 10 for High, and 16 for Critical. The Risk Register uses an approximate-match VLOOKUP against that sorted table.
Risk Reduction % compares the initial score with the residual score using (initial score − residual score) ÷ initial score. A score moving from 12 to 4 produces a 66.7% reduction.
The Risk Register provides dropdown lists for Risk Category and Status. Status options are Open, In Progress, Not Started, and Closed. Review the scoring references before changing the Risk Matrix thresholds.
No. It organizes evidence for identifying, assessing, treating, and monitoring risks under ISO 9001:2015 clause 6.1, but your organization must decide whether its records and actions meet its quality-management requirements.