Case Tracker Excel – Free Template (2026)
4
Free download
Track consulting candidates, interview rounds, case and fit scores, follow-up dates, scoring criteria, and recruiting metrics in an XLSX workbook.


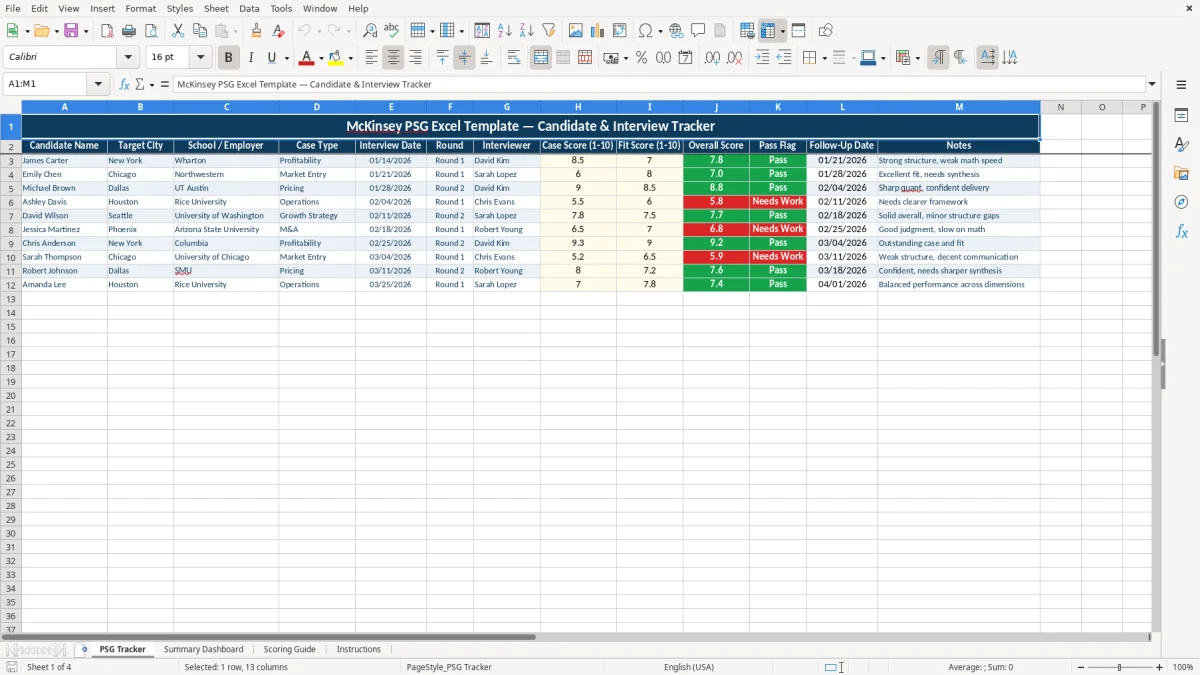
A consulting interview scorecard records candidate details, interview rounds, case performance, fit scores, notes, and follow-up dates in one XLSX workbook. This template includes a PSG Tracker, Summary Dashboard, Scoring Guide, and Instructions tab for consistent recruiting reviews.
Enter candidate information and scores in the pale-yellow cells on the PSG Tracker. The workbook calculates the Overall Score, assigns a Pass or Needs Work flag, adds a seven-day follow-up date, and summarizes results by round, case type, and interview date.
Independent interview coaches, recruiting coordinators, campus hiring teams, and consulting candidates can use this workbook when several interviews need to be compared using the same structure. A recruiter preparing for a weekly review can record the candidate, target city, school or employer, case type, interviewer, round, and interview date without keeping separate notes in email or a notebook.
The PSG Tracker includes Round 1, Round 2, and Round 3 as selectable values. A candidate who scores 8.5 on the case and 7 on fit receives an Overall Score of 7.75 because the workbook averages the two inputs. That result produces a Pass flag under the workbook's 7-point rule.
The tracker contains 10 prepared data rows, from row 3 through row 12. The sample records show different case types, including Profitability, Market Entry, and Pricing, so you can see how a mixed recruiting pipeline is organized before replacing the examples with your own records.
The Follow-Up Date column adds seven days to the Interview Date. For an interview dated 01/14/2026, the calculated follow-up date is 01/21/2026. That makes the sheet useful for a candidate preparing several practice cases or a small recruiting team reviewing feedback after each session.
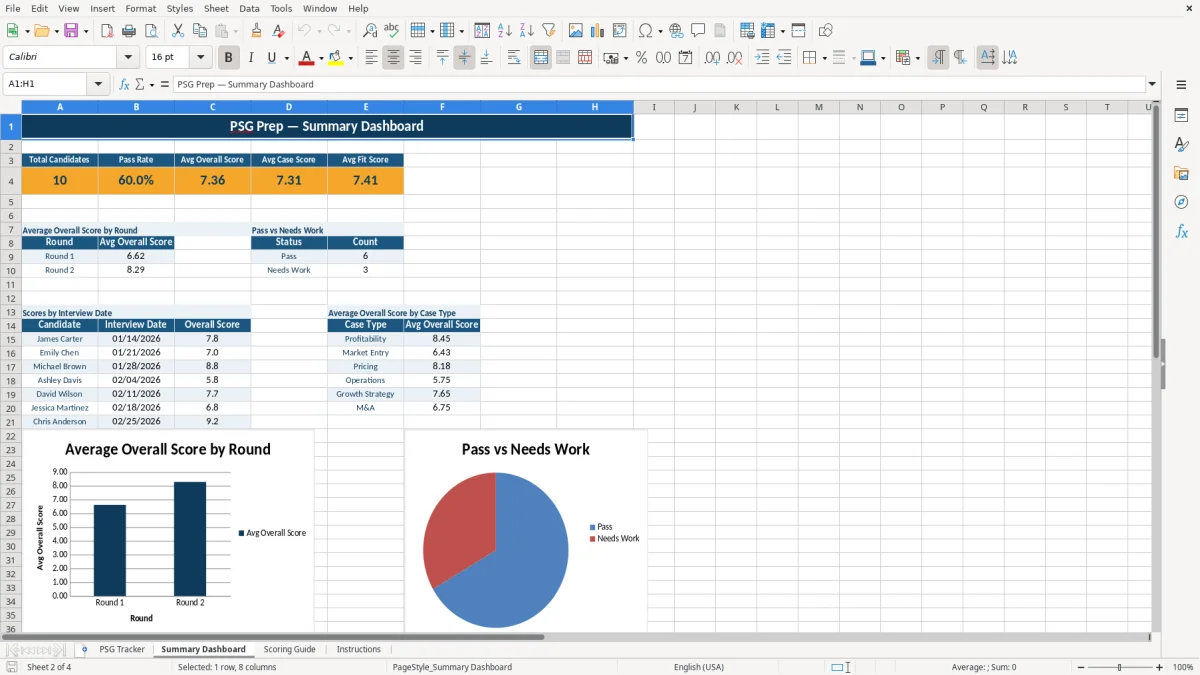
Image 1 shows the tracker layout, including score inputs, calculated status fields, and the notes column. Image 2 shows the Summary Dashboard, where the same records are grouped into recruiting metrics rather than reviewed one row at a time.
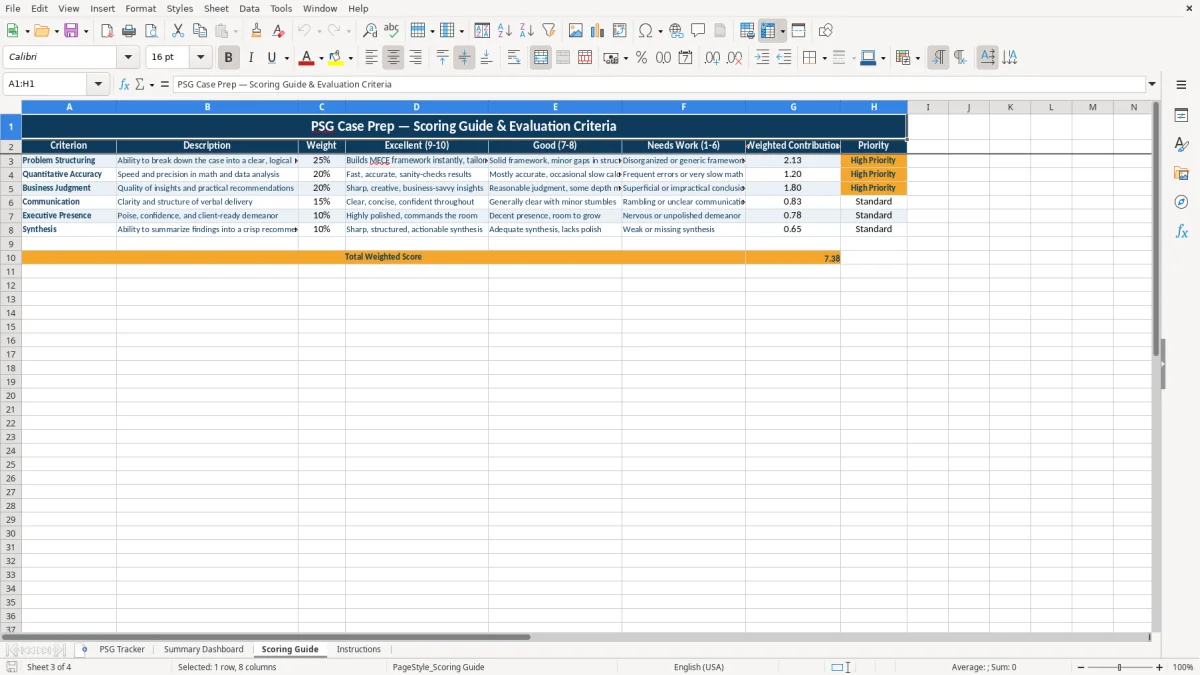
The Scoring Guide provides six criteria for evaluating case-interview performance: Problem Structuring, Quantitative Accuracy, Business Judgment, Communication, Executive Presence, and Synthesis. Each criterion includes a description plus performance language for Excellent (9-10), Good (7-8), and Needs Work (1-6).
The weights are 25% for Problem Structuring, 20% for Quantitative Accuracy, 20% for Business Judgment, 15% for Communication, 10% for Executive Presence, and 10% for Synthesis. The weights total 100%, so the guide gives you a complete rubric rather than an unweighted list of interview impressions.
The Priority column labels criteria weighted at 20% or more as High Priority. That means Problem Structuring, Quantitative Accuracy, and Business Judgment receive that label, while Communication, Executive Presence, and Synthesis are marked Standard. The Weighted Contribution column multiplies each weight by the linked Case Score, and the total appears at the bottom of the guide.
The tracker uses a separate overall decision rule: an average of 7 or higher produces Pass, while an average below 7 produces Needs Work. For example, a Case Score of 6 and Fit Score of 8 averages to 7, so the row is marked Pass even though the case score itself needs attention.
Image 3 shows the rubric columns and benchmark descriptions. Use the written benchmarks to make a score of 8 mean substantially the same thing across interviewers; do not treat the rubric as an automatic hiring decision.
The most damaging error is entering a score without recording what happened. A score of 6 tells you that a candidate needs work, but a note such as weak math speed, generic structure, or unclear synthesis identifies the next practice task. Without that detail, the follow-up conversation becomes a second interview rather than a focused review.
One interviewer may use 9 for a very good case while another reserves 9 for exceptional performance. The Scoring Guide addresses this with three benchmark bands: 9-10, 7-8, and 1-6. Use the descriptions before entering the Case Score or Fit Score, especially when two interviewers are comparing candidates for the same round.
Another problem is confusing the two score fields. The Case Score measures the case performance, while Fit Score captures the separate fit assessment. A candidate with 9 for the case and 5 for fit averages 7, which passes the workbook threshold but still requires a clear note explaining the fit concern.
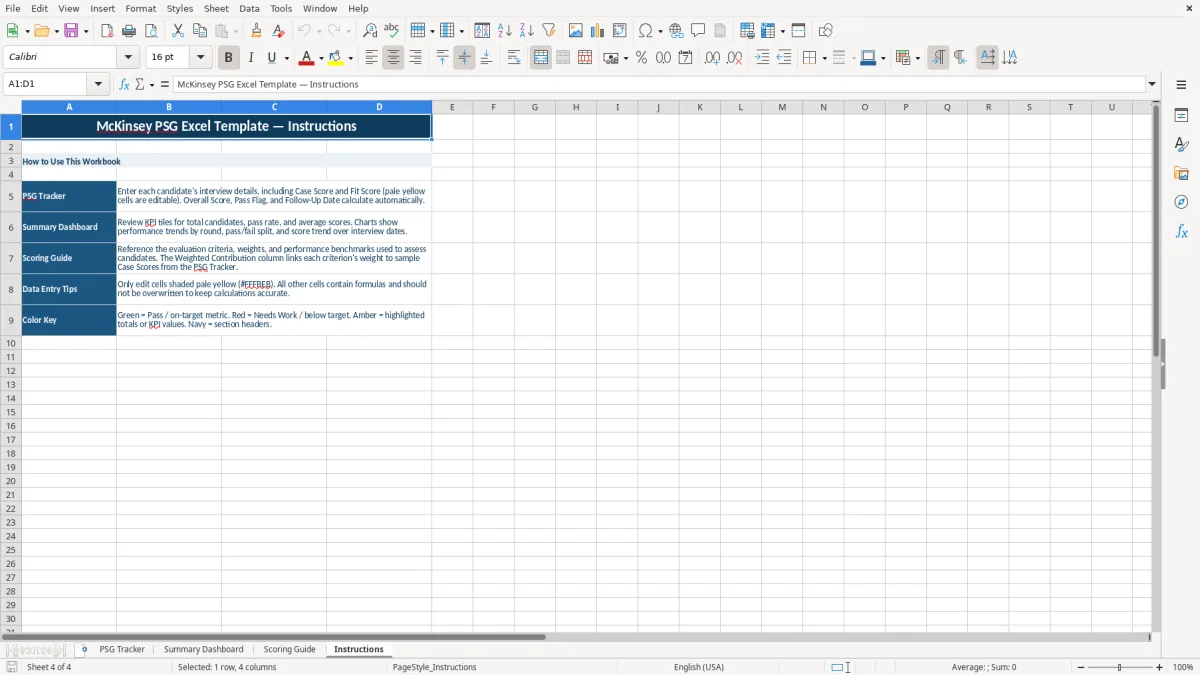
Overwriting Overall Score, Pass Flag, or Follow-Up Date removes the formulas that connect the tracker to the dashboard. The Instructions tab identifies pale-yellow cells as editable and says that other cells contain formulas. Treat that distinction as a control: enter facts and judgments only in input cells.
Image 4 shows the Instructions tab and its color key. Green indicates Pass or an on-target metric, red indicates Needs Work or below target, amber highlights totals or KPIs, and navy marks section headers. These visual cues help you spot an accidental status change before a recruiting review.
Use the workbook at one fixed point in your process: immediately after each interview or during the same-day debrief. Enter the interview date, round, interviewer, Case Score, Fit Score, and one concrete note before moving to the next candidate. A seven-day Follow-Up Date then gives you a consistent review point.
At the end of a recruiting week, review Summary Dashboard rather than manually calculating results. If five candidates are entered, the dashboard's Total Candidates, pass rate, average scores, round averages, status counts, date scores, and case-type averages should all provide the same picture from different angles.
This workbook is prepared with 10 tracker rows, so it suits a small interview pipeline or a focused preparation cycle. If you regularly need more than 10 active candidates, multiple reviewers per interview, detailed competency evidence, permissions, or a full audit history, move to a recruiting system rather than breaking the formula layout.
Keep the XLSX file in a controlled folder and save a clean copy before replacing the sample records. The workbook has no live feed or external integration; its value comes from disciplined entry, consistent scoring, and scheduled review.
It tracks candidate name, target city, school or employer, case type, interview date, round, interviewer, Case Score, Fit Score, Overall Score, Pass Flag, Follow-Up Date, and Notes on the PSG Tracker tab.
The workbook averages Case Score and Fit Score. For example, scores of 8.5 and 7 produce an Overall Score of 7.75.
An Overall Score of 7 or higher produces Pass. A score below 7 produces Needs Work. This is the workbook's scoring rule, not a universal recruiting standard.
The guide covers Problem Structuring, Quantitative Accuracy, Business Judgment, Communication, Executive Presence, and Synthesis, with weights ranging from 10% to 25% and benchmark descriptions for three performance bands.
You can replace the sample records and enter new information in the pale-yellow cells. Avoid overwriting calculated fields because the tracker and dashboard formulas depend on those cells. The workbook is provided in XLSX format.