Case Tracker Excel – Free Template (2026)
4
Free download
Record daily construction weather, crews, labor hours, delays, safety incidents, visitors, supervisors, labor costs, and dashboard KPIs.


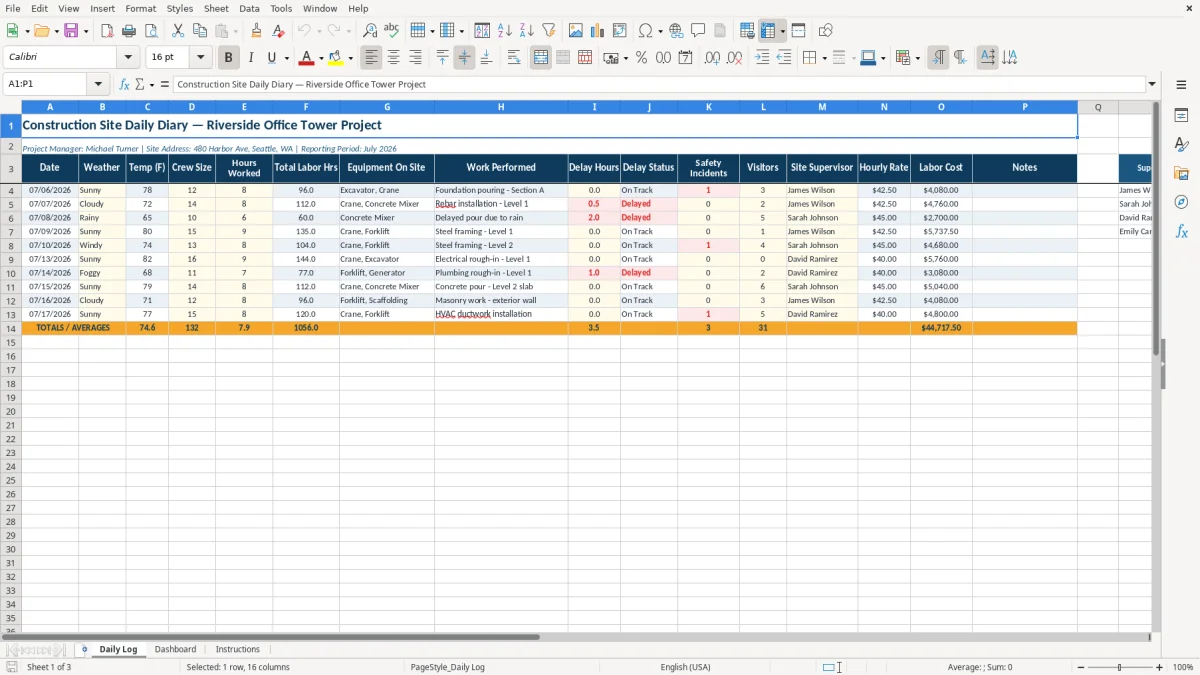
A construction site diary Excel workbook records one row for each working day, including weather, temperature, crew size, hours worked, equipment, work performed, delays, safety incidents, visitors, supervisors, hourly rates, and labor cost. It contains a Daily Log, a KPI dashboard, and instructions.
Use the Daily Log to document site conditions and progress while Excel calculates Total Labor Hrs, delay status, hourly rate, and labor cost. The Dashboard summarizes labor hours, delays, incidents, visitors, average temperature, labor cost, and weather counts for the entered rows.
A construction site diary is most useful to the person who has to turn field activity into a dependable daily record. A site supervisor can enter one row after the crew leaves, while a project manager can review labor, delays, safety incidents, visitors, and work performed without searching through text messages or separate notebooks.
The Daily Log is arranged around working days. Its sample rows show 07/06/2026 through 07/08/2026, with weather ranging from Sunny to Rainy, crew sizes from 10 to 14, and hours worked from 6 to 8. That structure fits a project office tracking concrete work, rebar installation, equipment, and weather-related disruption.
For example, the sample rainy day records 2 Delay Hours, a crew size of 10, and 6 Hours Worked. The sheet calculates 60 Total Labor Hrs and labels the day Delayed. That gives the project manager a direct record of the operational effect without requiring a separate calculation.
The supervisor selection connects daily work to the rate table on the right side of the Daily Log. James Wilson is listed at $42.50 per hour, Sarah Johnson at $45.00, and David Ramirez at $40.00. When you select a supervisor, the Hourly Rate column uses VLOOKUP, and Labor Cost multiplies that rate by Total Labor Hrs.
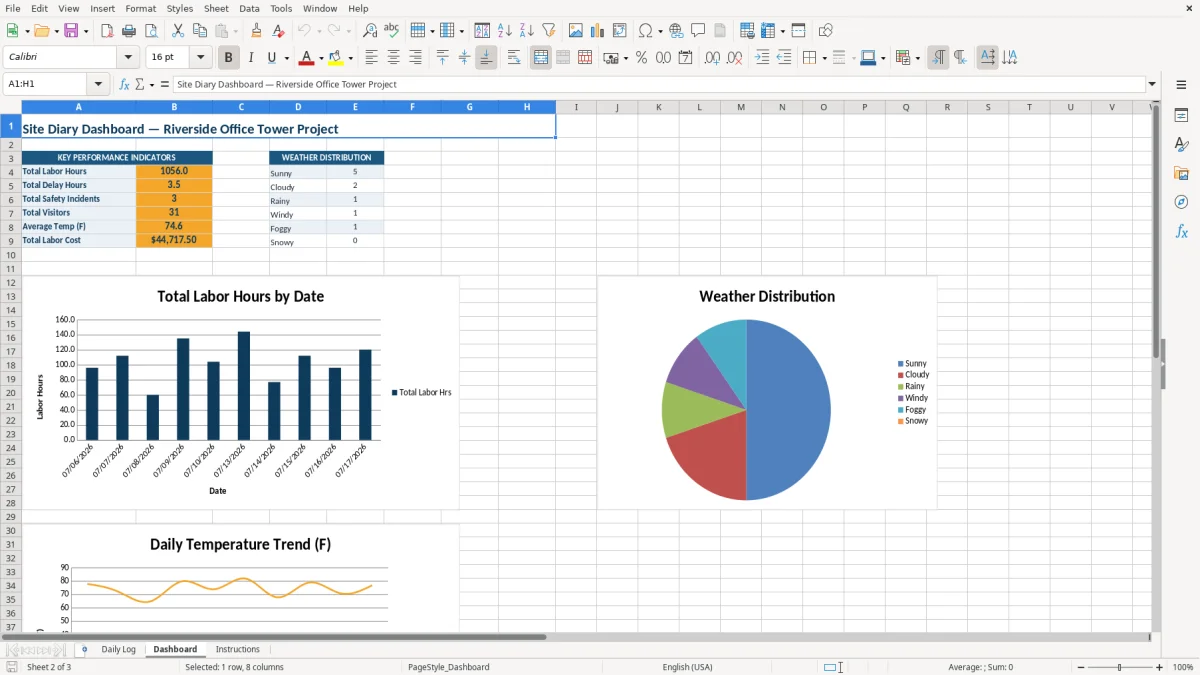
The Dashboard is useful during a weekly progress meeting or month-end review. Its KPI block summarizes labor hours, delays, safety incidents, visitors, average temperature, and labor cost, while its three charts show daily labor hours, temperature, and weather distribution.
This workbook is an operational record, not a replacement for a contract administration system or a formal safety reporting process. Its value comes from keeping the same fields together for each working day: site conditions, staffing, work activity, disruption, people on site, and calculated labor cost.
You enter Date, Weather, Temp (F), Crew Size, Hours Worked, Equipment On Site, Work Performed, Delay Hours, Safety Incidents, Visitors, Site Supervisor, and Notes. Weather and Site Supervisor use dropdown lists, which keeps entries consistent enough for the Dashboard's COUNTIF weather summary.
Excel calculates Total Labor Hrs in column F as Crew Size multiplied by Hours Worked. If a crew of 12 works 8 hours, the result is 96 labor hours. Delay Status in column J uses IF: any value greater than zero in Delay Hours produces Delayed; zero produces On Track.
The Supervisor and Hourly Rate table occupies columns R:S. The selected supervisor is matched to that table with VLOOKUP; if no match is found, IFERROR returns zero. Labor Cost then multiplies Total Labor Hrs by the looked-up rate. The sample 12-person, 8-hour day with James Wilson produces 96 labor hours and $4,080.00 of labor cost.
The totals row sums or averages the logged columns. The Dashboard links to those totals and counts each weather category from the Daily Log. Its charts use the prepared Daily Log ranges for daily labor hours and temperature, plus the Dashboard weather counts, so blank or newly inserted rows must be handled according to the Instructions tab.
The most damaging diary problems are usually small omissions repeated across several days. A supervisor may enter the crew and hours but leave Work Performed blank, or record a delay without stating what caused it. The result is a labor record that cannot explain the schedule history when someone reviews it later.
Typing weather variations such as Sunny, sunny, and Clear creates separate categories in a count. Use the Weather dropdown instead. The same discipline applies to Site Supervisor names: selecting James Wilson consistently allows the rate lookup to return the intended $42.50 sample rate.
Do not type over calculated cells in Total Labor Hrs, Delay Status, Hourly Rate, or Labor Cost. If a 14-person crew worked 8 hours, Total Labor Hrs should be 112. Replacing that formula with a typed number removes the connection between the staffing entry and the result.
A delay is not merely a status label. In the sample, the rainy day has 2 Delay Hours and 60 total labor hours. If the delay is documented without the weather, work description, or notes, the project record loses the context needed to understand why production changed.
Safety Incidents also require careful daily entry. The workbook highlights days where Delay Hours or Safety Incidents are greater than zero, but the highlight is a review signal, not a complete incident report. A recorded incident count of 1 should prompt you to consult the project's required safety documentation and preserve supporting details outside this simple diary when necessary.
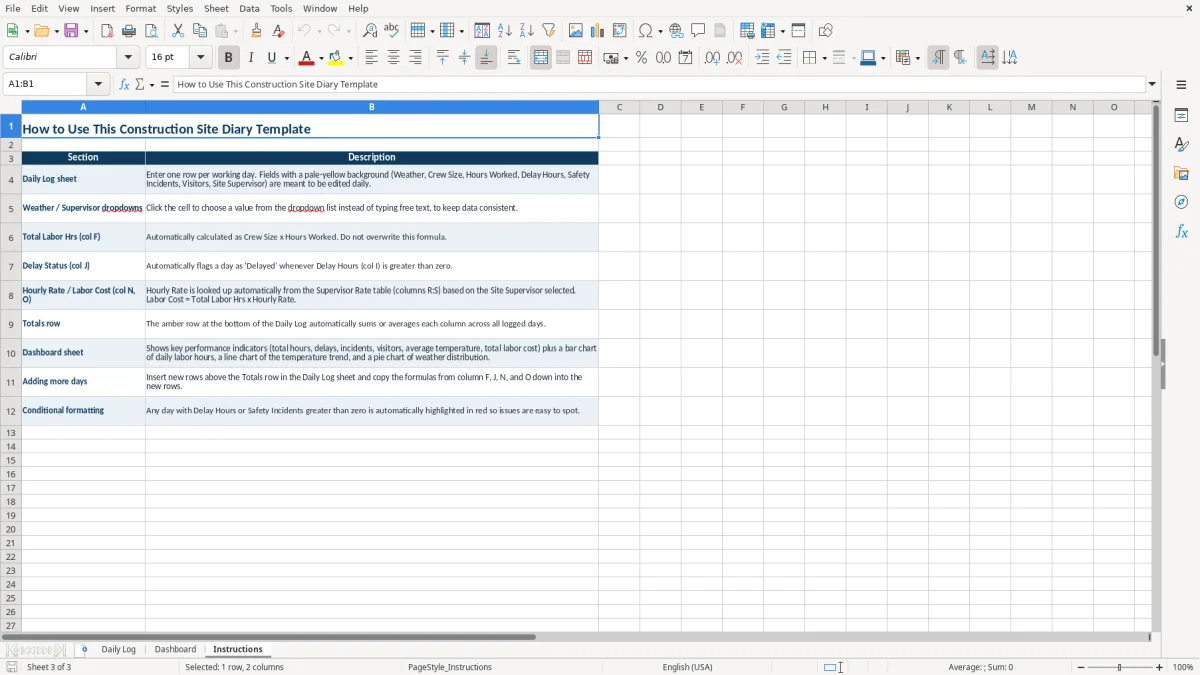
Adding days in the wrong place can separate the new record from the totals row or leave formula cells empty. The Instructions tab specifically directs you to insert rows above the Totals row and copy formulas in columns F, J, N, and O. Follow that sequence before relying on Dashboard totals or charts.
The workbook works best when the site diary is completed at a fixed point in the day rather than reconstructed at the end of the week. Set a short closeout routine after the final crew check: enter the date, weather, temperature, staffing, hours, equipment, work performed, delays, incidents, visitors, supervisor, and notes while the details are still available.
This sequence separates field facts from calculated outputs. For instance, entering 10 workers and 6 hours should produce 60 labor hours; if the result does not appear, check the formula cell rather than replacing it with a manual figure.
Open the Dashboard at the end of each week and compare the KPI block with the Daily Log. Pay particular attention to Total Delay Hours and Total Safety Incidents, then use the charts to spot changes in daily labor hours or temperature. A rainy day with 2 delay hours should be visible in the detail row and reflected in the summary.
When the prepared rows are used, follow the Instructions tab for adding more days: insert new rows above the totals row and copy formulas in F, J, N, and O. This XLSX workbook does not include a live data feed or a table that automatically extends formulas, so row maintenance is a deliberate Excel task.
The Daily Log records Date, Weather, Temp (F), Crew Size, Hours Worked, Total Labor Hrs, Equipment On Site, Work Performed, Delay Hours, Delay Status, Safety Incidents, Visitors, Site Supervisor, Hourly Rate, Labor Cost, and Notes.
Total Labor Hrs is calculated from Crew Size multiplied by Hours Worked. Delay Status returns Delayed when Delay Hours is greater than zero. Hourly Rate is found from the supervisor rate table, and Labor Cost equals Total Labor Hrs multiplied by Hourly Rate.
Use the dropdown cells in the Daily Log. Weather choices are Sunny, Cloudy, Rainy, Windy, Snowy, and Foggy. Site Supervisor choices are James Wilson, Sarah Johnson, David Ramirez, and Emily Carter.
The Dashboard shows Total Labor Hours, Total Delay Hours, Total Safety Incidents, Total Visitors, Average Temp (F), and Total Labor Cost. It also includes charts for daily labor hours, daily temperature, and weather distribution.
Insert a new row above the Totals row in the Daily Log, then copy the formulas from columns F, J, N, and O into the new row. The Instructions tab provides the workbook's specific guidance for this process.
A highlighted day has Delay Hours greater than zero or Safety Incidents greater than zero. Review the row's work description and notes, then follow your project's separate procedures for documenting delays or safety events.