Amazon FBA Inventory Cost Excel - Free Template
Track Amazon FBA landed cost, fees, revenue, profit, margin, and reorder flags for each SKU.


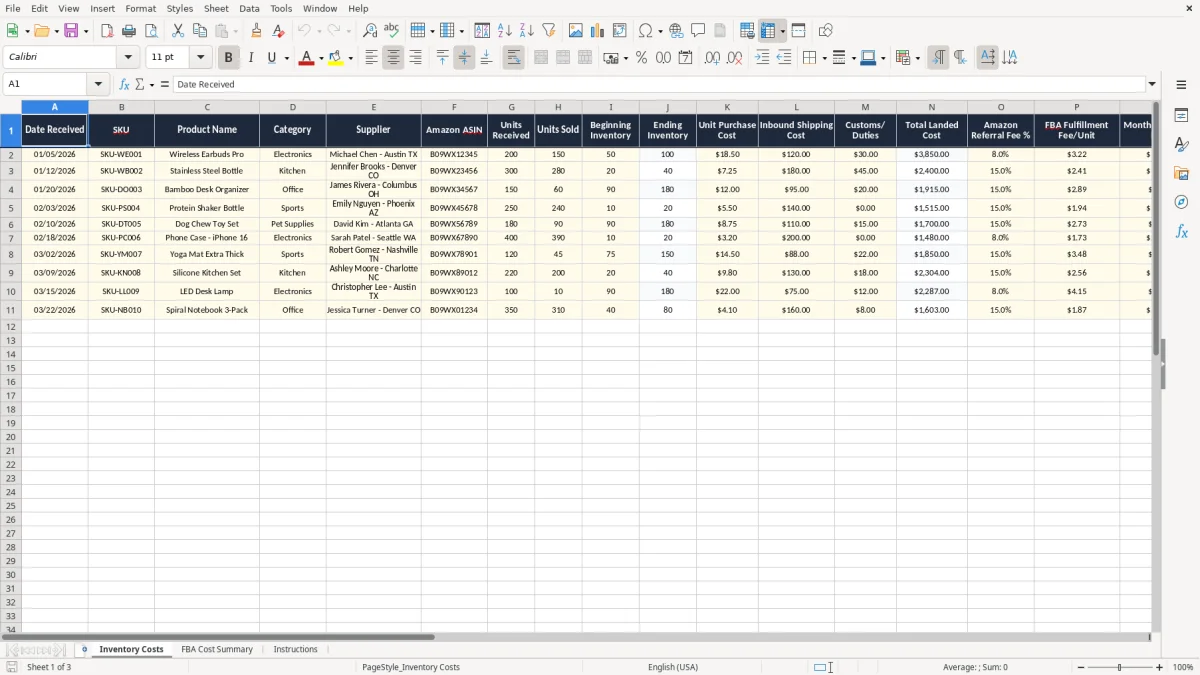
This Amazon FBA inventory cost Excel spreadsheet tracks each SKU’s landed cost, Amazon fees, revenue, gross profit, gross margin, inventory status, and reorder flag. It includes the Inventory Costs, FBA Cost Summary, and Instructions tabs.
Use it to see what a product really costs after inbound freight, customs, referral fees, FBA fulfillment fees, storage, and returns. The layout is built for one row per SKU or replenishment lot, so you can compare a 200-unit purchase at $18.50 with a $49.99 selling price and know whether the margin still works.
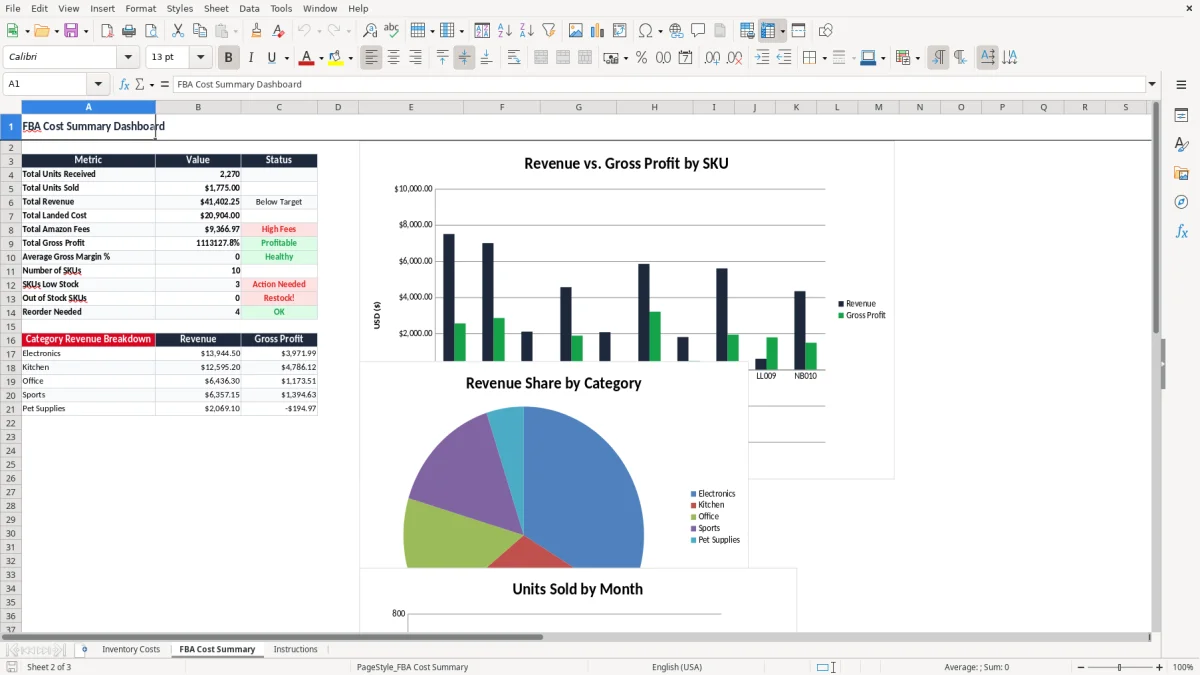
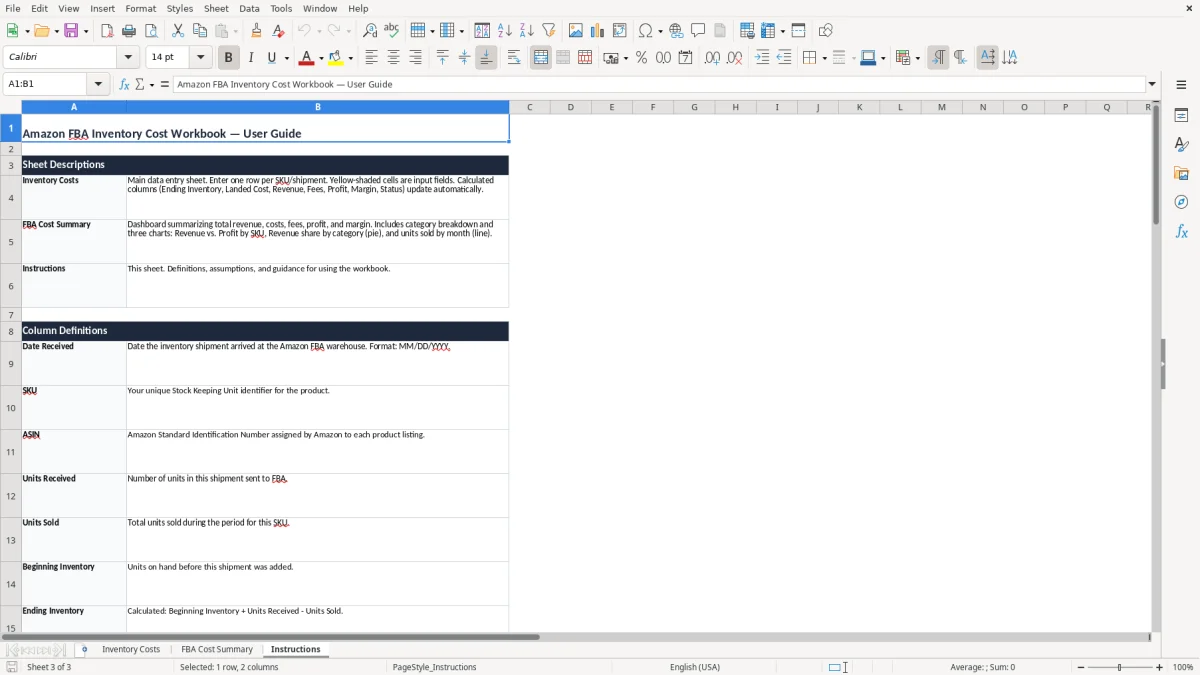
The screenshots show a clean working file, not a dashboard-first workbook. Image 1 is the detailed entry sheet, image 2 is the summary view, and image 3 gives you the setup notes.
Key benefits of this Excel template
- Shows landed cost per SKU by combining purchase cost, inbound shipping, and customs/duties.
- Calculates gross profit and gross margin % from each product’s selling price and Amazon fee load.
- Flags low stock when Ending Inventory falls below the Reorder Point.
- Helps you see whether a product still works after an 8% referral fee and a per-unit FBA charge.
- Keeps sales, fees, and inventory movement in one row, which is easier than juggling separate tabs.
- Makes it simple to compare products with different return rates and storage costs.
- Gives you a fast monthly view of which SKUs are profitable and which ones need a price change or a restock.
Step-by-step guide
- Enter each SKU on the Inventory Costs tab. Fill in the date received, product name, supplier, Amazon ASIN, and the unit counts.
- Type the cost inputs first. Use purchase cost, inbound shipping, customs/duties, referral fee %, FBA fulfillment fee, storage fee, and return rate %.
- Review the calculated columns. The sheet uses the entered numbers to show total landed cost, revenue, Amazon fees, gross profit, and gross margin %.
- Set a reorder point for each product. When ending inventory drops to or below that level, the Reorder Flag highlights the line for action.
- Check the FBA Cost Summary tab to compare SKUs side by side and see which products carry the best margin.
- Use the Instructions tab if you are updating the file for the first time or handing it to a team member.
Included features
How Amazon Sellers Use This Inventory Cost Tracker
This workbook is for Amazon sellers who need to know whether a SKU actually makes money after FBA costs, not just whether it sold. A solo sole proprietor with 40 active listings may use it at month-end to see which products can survive a fee increase, while a small LLC with a VA or bookkeeper can update it after each replenishment order.
The structure fits real operating decisions. If you buy 200 units at $18.50, pay $120.00 inbound freight, and sell at $49.99, you can see whether the margin still works before you reorder another pallet.
When You Need It
You usually reach for this sheet during replenishment planning, month-end review, or before a price change. A seller moving 300 orders a month can compare products with thin margins and pull the weak SKUs before they eat cash flow.
Who Benefits Most
It also helps a controller, e-commerce bookkeeper, or operator who needs a simple profit & loss check by product. If a household side business is mixing personal cash with Amazon payouts, this file gives a cleaner view of what each item is really producing.
What The IRS And Accounting Rules Mean For Amazon FBA Records
For tax support, keep the records behind each line: purchase invoices, freight bills, Amazon settlement reports, and customs documents. The IRS generally expects you to keep business records for 3 years, and longer in cases with asset questions or larger underreporting issues; for Amazon inventory, the paper trail matters because landed cost affects your Schedule C profit.
If you are a sole proprietor, your FBA net income flows to Form 1040 through Schedule C, and your self-employment tax is computed on Schedule SE. If your business is an LLC taxed as a disregarded entity, the bookkeeping is still the same at the product level; the entity label does not change the need to know true unit cost.
Why Landed Cost Beats Sticker Cost
Sticker cost alone can mislead you. A $18.50 unit that picked up $0.60 in inbound freight, $0.15 in customs, and a $3.22 FBA fee is not the same business as a $18.50 unit with no freight and a smaller fee load.
How To Read The Summary
Use the summary tab to compare margin by SKU, not just by revenue. A product with $12,000 in monthly sales but only a 9% margin leaves you $1,080 before advertising, returns, and overhead, which is a weak place to run an Amazon business.
Where Amazon FBA Cost Sheets Go Wrong And What It Costs
The most expensive mistake is treating Amazon payouts as profit. A seller sees $49.99 in revenue, ignores a 15% referral fee, a $3.22 fulfillment fee, a $12.50 return rate effect, and then wonders why cash is missing at the end of the month.
Another common failure is letting ending inventory sit above the reorder point until stockouts begin. If you sell 150 units and only reorder after you hit zero, you can lose a full week of Buy Box velocity; on a $6,000 monthly sales product, one week out of stock can wipe out roughly $1,500 in revenue.
Bad Inputs Create Bad Margins
If your inbound freight is split across multiple SKUs and you leave it off the sheet, gross margin is overstated from day one. On a 500-unit buy, missing even $200 of freight adds only $0.40 per unit, but that is enough to turn a 14% margin into 12% when the product is already tight.
Returns And Storage Are Not Noise
High-return products need special attention because the return rate pushes real cost above the clean unit math. A 2% return rate on a 300-order month means about 6 returns; if each return costs you $8.00 in fees and lost margin, that is $48.00 gone before you even count the refund impact.
How To Make The FBA Spreadsheet Part Of Your Monthly Routine
The easiest way to keep this workbook alive is to tie it to a fixed event you already do, such as your Amazon payout review or month-end close. If you update it every Friday after downloading the settlement report, you catch pricing problems before they pile up for a quarter.
Simple Habits That Keep It Current
- Copy the prior row set when you restock a SKU, then change only the new receipt date and cost fields.
- Use the same naming format for products and suppliers so the summary stays readable across months.
- Review reorder flags on the same day you look at inventory receipts, so restock decisions do not get delayed.
- Keep the freight and customs numbers from the invoice beside the sheet so landed cost stays accurate.
When To Move Beyond A Spreadsheet
If you are managing hundreds of SKUs, multi-channel stock, or a team that needs live purchase orders and warehouse sync, the spreadsheet stops being enough. At that point, a real inventory system or a full bookkeeping platform will handle the volume better than manual entry.
Frequently asked questions
It tracks SKU-level cost, inventory movement, Amazon fees, revenue, gross profit, gross margin %, and reorder status. You enter the received quantity and pricing inputs, then review the calculated margin on each row.
Yes. The sheet has separate columns for Amazon Referral Fee % and FBA Fulfillment Fee/Unit, so you can see how Amazon’s fee stack affects each product’s margin.
Landed cost combines unit purchase cost, inbound shipping, and customs/duties. That gives you a truer cost per unit than purchase price alone, which is the number that matters when you set a selling price.
Yes. Enter a Reorder Point for each SKU, then compare it to Ending Inventory. When stock drops to that level, the Reorder Flag helps you see which products need attention first.
It helps support your bookkeeping by keeping inventory cost, sales, and fee detail in one place. That makes it easier to back up your Schedule C numbers and reconcile Amazon settlement data to your books.
It is built for Amazon sellers, e-commerce bookkeepers, and small-business owners who need a simple way to monitor product margin. A one-person store and a small LLC can both use it without needing a full ERP system.
Who made this template