Case Tracker Excel – Free Template (2026)
4
Free download
Track revenue, expenses, profit, margins, and categories with a horizontal bar chart dashboard in this XLSX workbook.


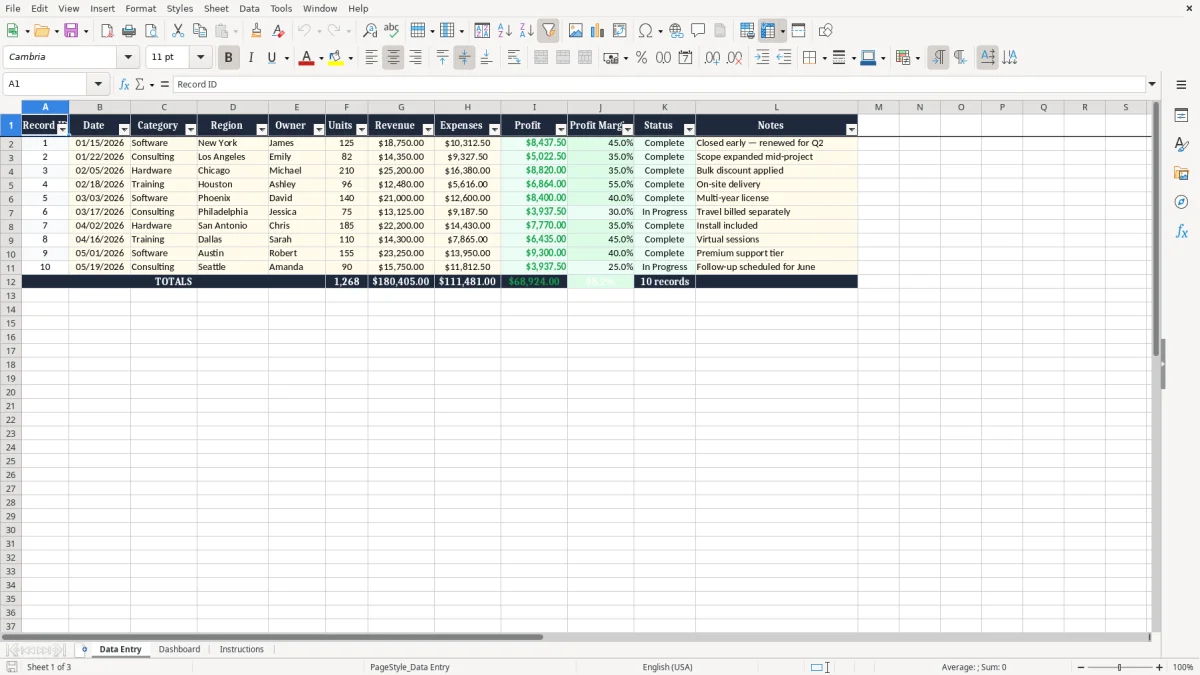
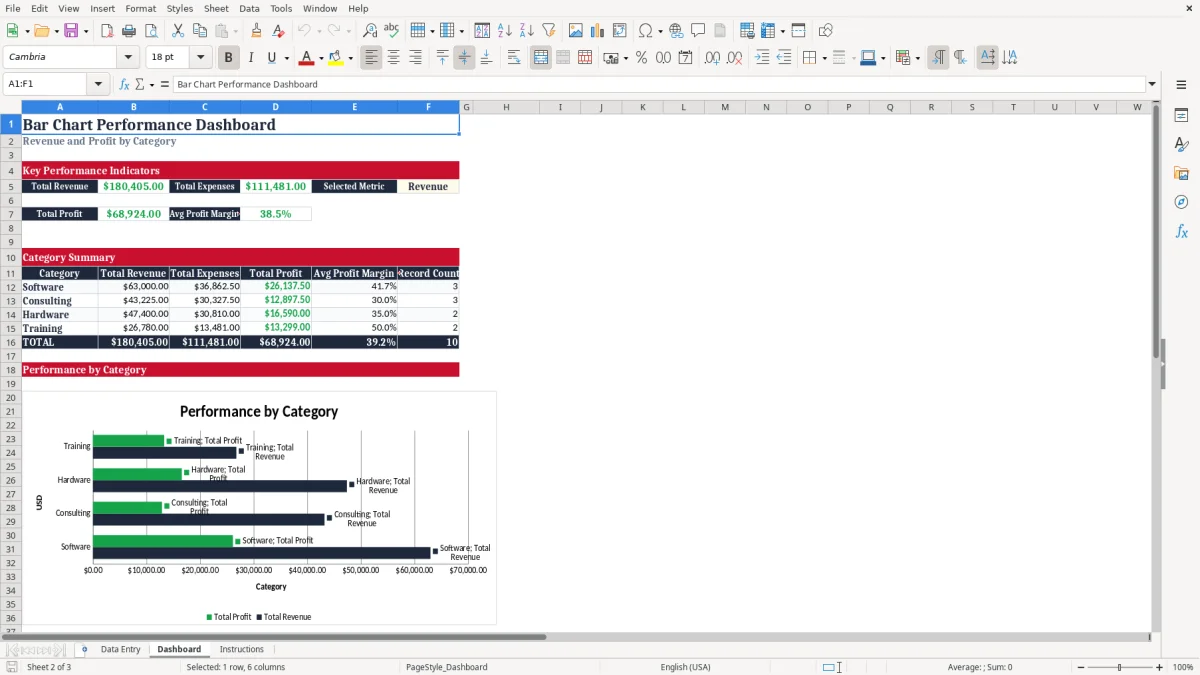
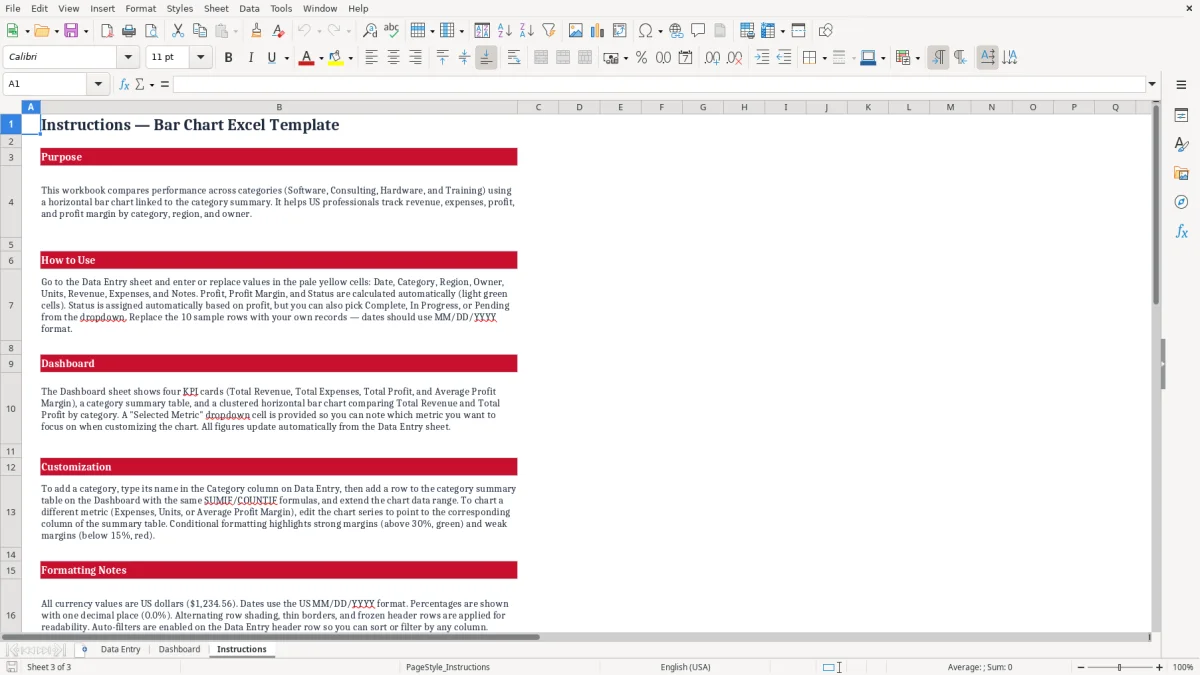
This bar chart Excel template compares Revenue and Profit across Software, Consulting, Hardware, and Training categories. It includes a Data Entry sheet for records, a Dashboard with KPI cards and a horizontal clustered bar chart, and an Instructions sheet explaining the workbook.
Enter dates, categories, regions, owners, units, revenue, expenses, and notes in the pale yellow cells. The workbook calculates profit, profit margin, status, category totals, record counts, and the dashboard summary in U.S. dollars.
A sales manager can use this workbook during a weekly pipeline meeting, while an operations lead can use it during month-end review. The Data Entry sheet captures one record per activity or project, including Date, Category, Region, Owner, Units, Revenue, and Expenses. The sample workbook contains 10 populated records across four categories, so you can see the comparison before replacing the entries.
Suppose an online services team records a Software project with $18,750 in Revenue and $10,312.50 in Expenses. The calculated Profit is $8,437.50, and the Dashboard places that category beside Consulting, Hardware, and Training for a quick visual comparison. The chart is useful when a table of dollar amounts is too slow to interpret in a meeting.
An office manager can enter records by owner or region, then review the category summary after a Friday update. A finance coordinator can use the same sheet at month-end to compare revenue generation with direct expenses without building a separate chart from scratch.
The strongest use is a recurring review: enter new records during the week, check the calculated columns, and open the Dashboard before the monthly meeting. The summary shows Total Revenue, Total Expenses, Total Profit, Average Profit Margin, and Record Count for each listed category.
This is a practical comparison workbook, not a full accounting system. Keep transaction-level accounting in your bookkeeping software; use this file when category-level performance and a clear horizontal bar chart are the decision you need.
The workbook uses transparent Excel formulas rather than hidden calculations. On Data Entry, Profit is calculated as Revenue minus Expenses, Profit Margin divides Profit by Revenue through IFERROR, and Status uses thresholds built into the sample formula: profit above $5,000 is Complete, profit above $0 is In Progress, and zero or negative profit is Pending.
The Dashboard uses SUM to total Revenue, Expenses, and Profit across the prepared entry range. It uses AVERAGE for the overall profit margin, while the category rows use SUMIF for dollar totals, AVERAGEIF for category margin, and COUNTIF for record counts. For example, the Software row adds only records whose Category cell equals Software.
These formulas are best suited to the workbook's prepared range of rows 2 through 11. If you add records beyond that range, update the related Dashboard formulas and chart source deliberately; the workbook does not contain an Excel table or an automatic expansion feature.
The chart is a horizontal clustered bar chart linked to Dashboard category rows 12 through 15. Its two series are Total Revenue and Total Profit, with categories supplied by the four category labels. The Selected Metric cell offers Revenue, Expenses, Profit, or Units as labels, but changing it does not switch the chart series or summary formulas.
To show Expenses or Units, you must edit the chart source manually and confirm the series references. Keep dollar measures together in the current chart; mixing Units with currency on one axis can produce a misleading visual comparison.
The most common failure is changing the Selected Metric dropdown and assuming the chart changed. It does not. The workbook instructions explicitly identify that cell as informational only, while the chart continues to display Revenue and Profit. A presentation that labels the selection as Units but shows dollars can mislead the audience even though no formula has broken.
Profit, Profit Margin, and Status are calculated outputs. If you type over those formulas, the row can stop reflecting Revenue and Expenses. For example, entering $25,200 of Revenue and $16,380 of Expenses should produce $8,820 of Profit; a hard-coded value of $7,500 would distort both the category summary and the bar chart.
Another problem occurs when a new category is typed into Data Entry but not added to the Dashboard summary. The current summary lists Software, Consulting, Hardware, and Training only. A fifth category will not appear in the chart unless you add its summary row, copy the correct SUMIF, AVERAGEIF, and COUNTIF formulas, and update the chart range.
Revenue and Profit are both dollar measures, but their scales may differ substantially. If one category has $25,200 of Revenue and another has much lower sales, the shorter bar may look insignificant even when its margin is strong. Read the Avg Profit Margin column beside the chart instead of judging profitability from bar length alone.
Finally, blank or zero Revenue values can produce a zero margin through IFERROR. That prevents a visible spreadsheet error, but it also means you should investigate incomplete records before using the Dashboard for a management decision.
Set one fixed entry time, such as Friday afternoon, and add each completed record before the weekly performance meeting. Entering 10 records at once takes longer and makes it easier to confuse a Region, Owner, or Expense value. The workbook already separates input fields from calculated outputs, so preserve that structure.
For a monthly review, save a dated copy after checking the Dashboard. A simple naming pattern such as Performance-January-2026.xlsx helps you preserve the prior month without overwriting the current file. Keep the source records consistent so category comparisons remain meaningful.
This XLSX template is appropriate for a compact prepared range and a focused category comparison. Move to a database, accounting platform, or reporting system when you need hundreds or thousands of records, user permissions, automated imports, audit history, or charts that expand without manual range edits.
Do not use the Selected Metric cell as a control for chart switching. If you need a different visual, edit the chart source, test the series, and save a separate version so the original Revenue-and-Profit view remains available.
It compares Total Revenue and Total Profit across Software, Consulting, Hardware, and Training in a horizontal clustered bar chart. The Dashboard also shows Total Expenses, Average Profit Margin, category totals, and record counts.
You can enter or replace Date, Category, Region, Owner, Units, Revenue, Expenses, and Notes. Record ID is included, while Profit, Profit Margin, and Status are calculated columns.
No. Selected Metric is informational only. Changing it does not change the chart series or summary formulas; the chart continues to show Revenue and Profit.
Edit the chart source manually and replace or add the desired data series from the Dashboard summary. Verify the category range and values before using the revised chart.
Yes, but it requires manual updates. Add the category in Data Entry, add a matching row to the Dashboard summary with the appropriate SUMIF, AVERAGEIF, and COUNTIF formulas, then extend the chart source to include that row.