Case Tracker Excel – Free Template (2026)
4
Free download
Track project owners, dates, budgets, status, progress, variance and deadlines with a three-tab XLSX project portfolio template.


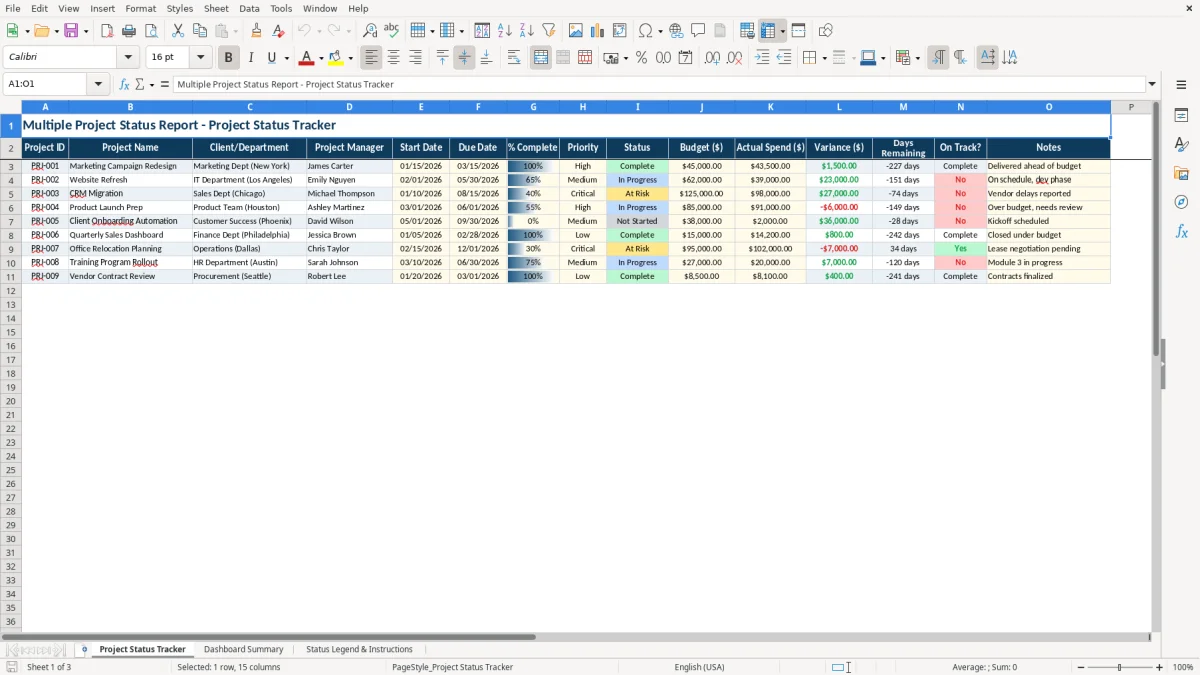
This multiple project status report Excel template tracks project IDs, managers, clients or departments, dates, completion percentages, priorities, budgets, actual spending, status and notes. Its three tabs combine a detailed tracker, an executive dashboard and a status legend with instructions.
Use the Project Status Tracker to enter project information in the pale yellow cells. The workbook calculates variance, days remaining and the due-date-based On Track result, while the Dashboard Summary consolidates project counts, progress and budget totals.
A project manager overseeing several workstreams can use this workbook during a weekly portfolio meeting, while an operations director can use it before an executive review. The tracker separates a marketing campaign, website refresh and CRM migration by project ID, department, manager, dates, priority and status instead of forcing those details into separate notes.
Image 1 shows the Project Status Tracker with columns for Project Name, Client/Department, Project Manager, Start Date, Due Date, % Complete, Priority, Status, Budget ($), Actual Spend ($), Variance ($), Days Remaining, On Track? and Notes. The sample CRM Migration is 40% complete, marked Critical and At Risk, with a $125,000 budget and $98,000 actual spend.
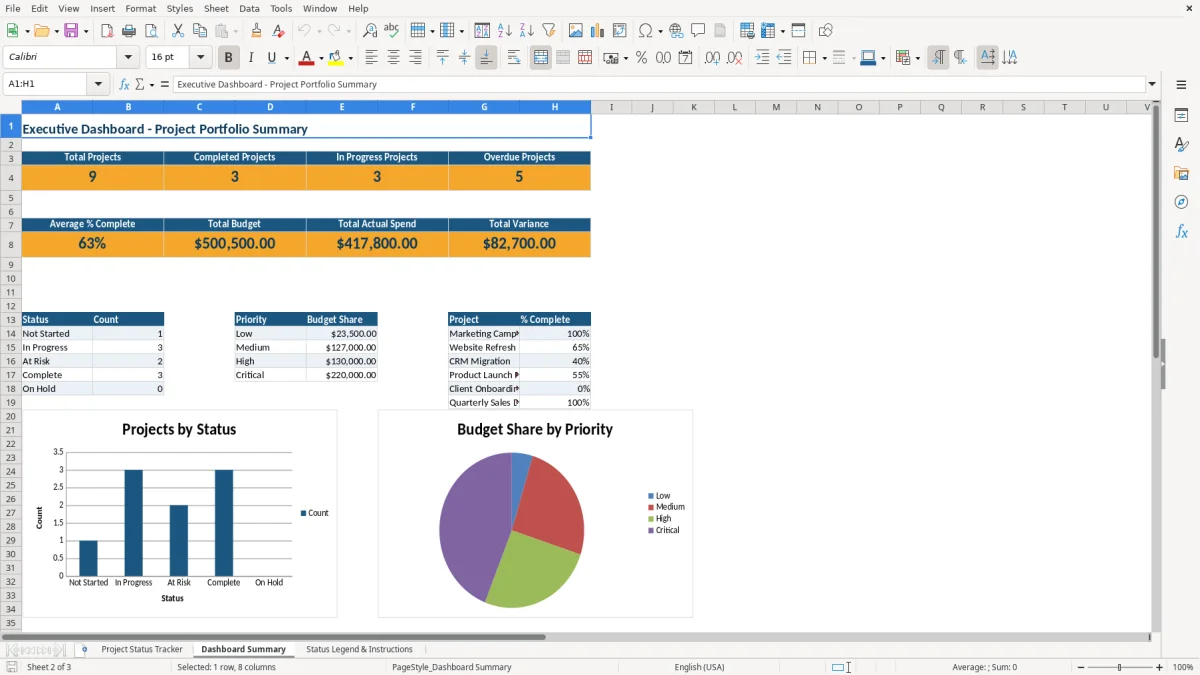
Image 2 shows the Dashboard Summary. It brings together total projects, completed projects, in-progress projects, overdue projects, average completion, total budget, actual spend and variance. A department leader can use those figures to decide whether the CRM migration needs escalation while the website refresh remains in development.
This is most useful for teams managing a small portfolio where each project needs a visible owner and deadline. The workbook contains nine populated project rows; use the existing layout as the reporting model rather than assuming new rows will receive every prepared formula automatically.
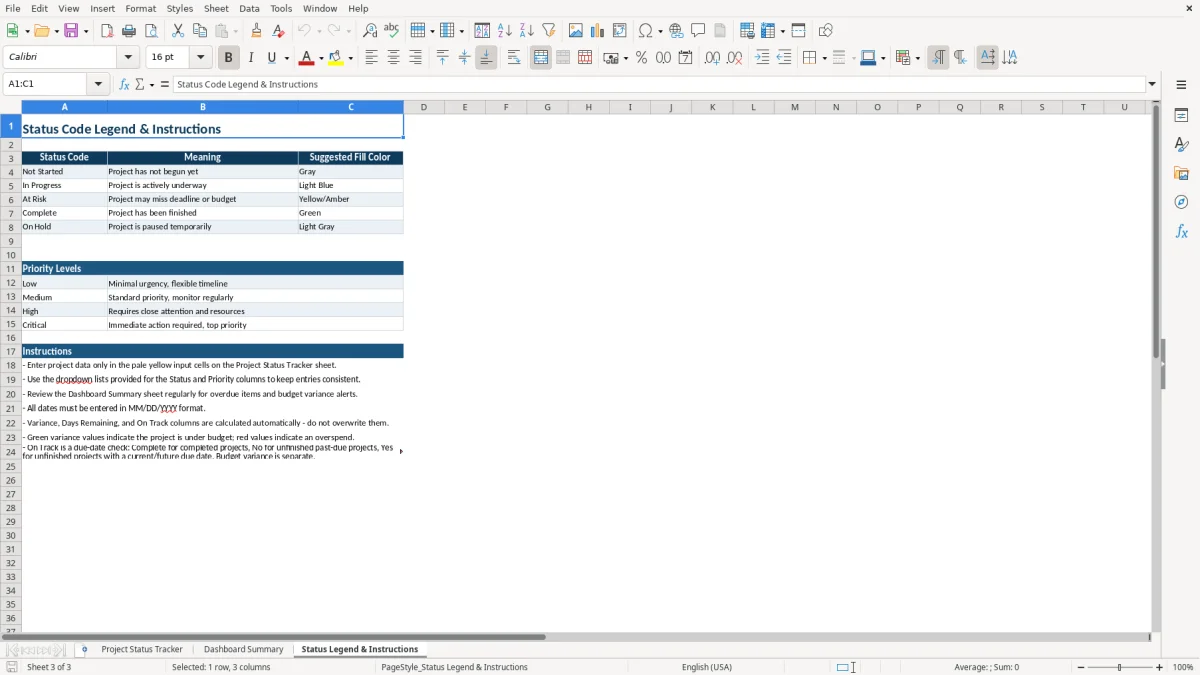
The workbook uses dates, status values and budget fields to produce a consistent operating view. In the tracker, Variance is calculated as Budget ($) minus Actual Spend ($). A positive result means spending is below budget; a negative result indicates an overspend.
Days Remaining calculates Due Date minus TODAY(). On Track? returns Complete when Status is Complete. Otherwise, it returns No when the due date has passed, Yes when the due date is current or future, and Check date when the due date is blank or not recognized as a date.
Image 2 reflects dashboard formulas that reference tracker ranges through row 2000 for several portfolio measures. The summary counts completed and in-progress projects, calculates average % Complete, and sums Budget ($), Actual Spend ($) and Variance ($). It also counts each status and sums budget by Low, Medium, High and Critical priority.
The tracker’s input guidance requires MM/DD/YYYY dates and numeric progress values from 0 to 100. The status rule is deliberately narrow: On Track? is a due-date check, not a complete risk assessment. A project can be under budget yet still show No if its unfinished due date is in the past.
The most damaging error is overwriting a calculated column. If someone types over Variance, Days Remaining or On Track?, the row can display a plausible number while no longer responding to changed dates or spending. The Status Legend & Instructions tab explicitly identifies these three fields as calculated outputs.
Typing “In progress” instead of choosing In Progress can cause the dashboard’s COUNTIF formulas to miss the project. The same problem affects priorities: a manually typed “Urgent” will not be included in the Low, Medium, High or Critical budget groupings.
A completed project with a past due date is not treated as overdue when Status is Complete. Conversely, an unfinished project with a due date before TODAY() returns No, even if % Complete is 95. That distinction matters: a project one task from completion can still require a deadline discussion.
Another practical failure is assuming the dashboard expands every formula into newly inserted tracker rows. The visible tracker contains nine sample rows, while dashboard formulas use broad references; new rows should be checked carefully to confirm that the intended calculations and displayed project list remain populated.
Set one recurring update time before the portfolio meeting, such as Monday afternoon. Each project manager should update % Complete, Status, Actual Spend, Due Date and Notes before the review; otherwise the dashboard becomes a snapshot of old information rather than a management tool.
Keep data entry in the pale yellow cells and preserve the dropdown choices. Before adding a new project, copy the intended row structure and verify that Variance, Days Remaining and On Track? contain formulas; the workbook does not automatically prepare formulas in every new row.
Use the Status Legend & Instructions tab as the handoff page for new contributors. When the portfolio grows beyond a manageable review in one worksheet, or when you need formal task dependencies, audit history or user permissions, move to a project system rather than adding complexity blindly to this XLSX report.
It tracks Project ID, Project Name, Client/Department, Project Manager, Start Date, Due Date, % Complete, Priority, Status, Budget ($), Actual Spend ($), Variance ($), Days Remaining, On Track? and Notes.
The workbook contains Project Status Tracker, Dashboard Summary, and Status Legend & Instructions. Image 1 shows the tracker, image 2 shows the dashboard, and image 3 shows the legend and usage guidance.
Complete projects display Complete. Unfinished projects display No when the due date has passed and Yes when the due date is current or future. A blank or invalid due date displays Check date.
Enter progress as a number from 0 to 100, such as 65 for 65% complete. The sample Website Refresh row uses 65.
The workbook includes nine populated sample rows and dashboard references that extend through row 2000 for several calculations. New rows do not automatically receive every tracker formula, so verify the calculated columns after adding a project.
You can replace the sample project information with your own portfolio data. Preserve the calculated columns and use the Status and Priority dropdowns so the dashboard formulas recognize your entries.