Case Tracker Excel – Free Template (2026)
4
Free download
Plan campaigns with dates, owners, budgets, leads, conversions, CPL benchmarks, KPIs, charts, and status tracking in an XLSX workbook.


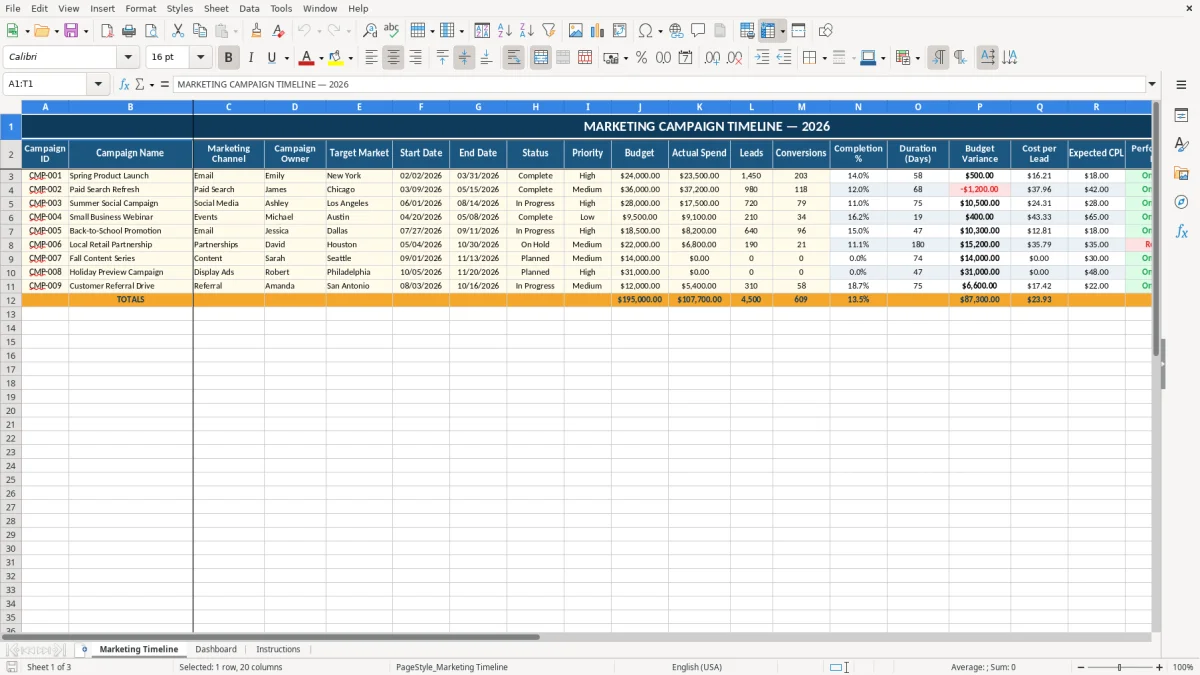
A marketing timeline Excel workbook organizes campaign names, channels, owners, target markets, dates, budgets, spending, leads, and conversions in one schedule. It also calculates duration, completion rate, budget variance, cost per lead, expected CPL, and a performance flag for each campaign.
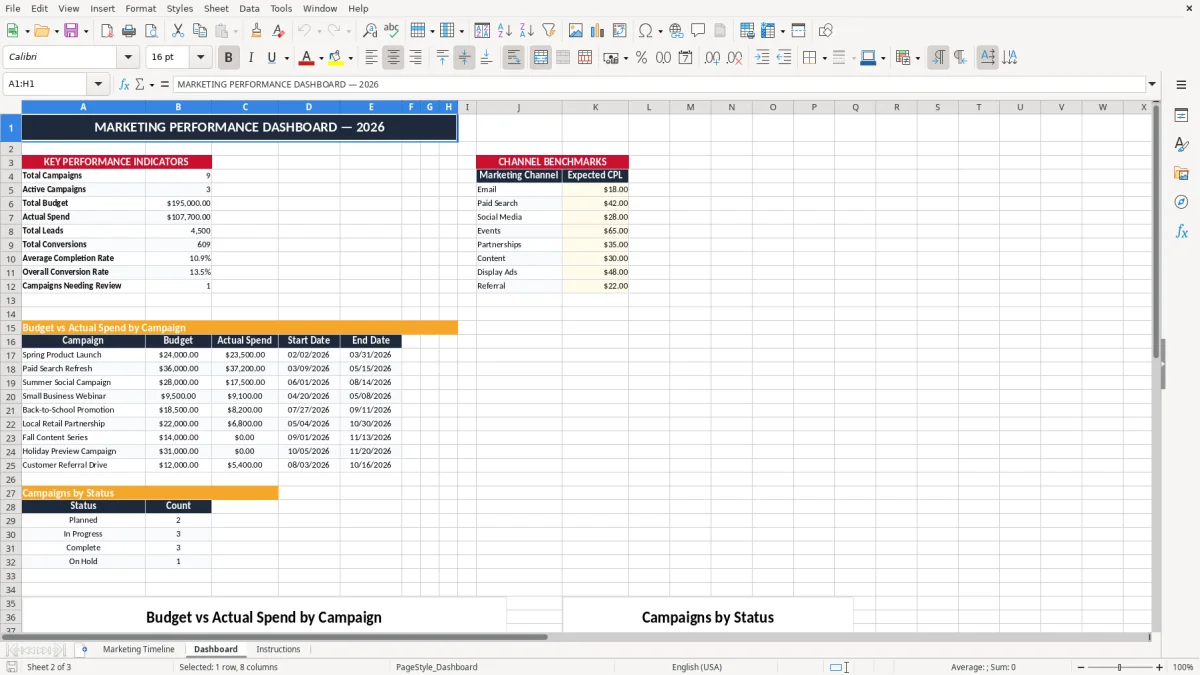
The workbook includes three tabs: Marketing Timeline, Dashboard, and Instructions. The first tab contains 9 prepared campaign rows, while the Dashboard summarizes campaign activity with KPIs, benchmark assumptions, and three charts.
A marketing coordinator can use the Marketing Timeline tab to coordinate several campaigns that overlap during 2026. The workbook's sample rows include a Spring Product Launch running from 02/02/2026 through 03/31/2026, a Paid Search Refresh from 03/09/2026 through 05/15/2026, and a Summer Social Campaign from 06/01/2026 through 08/14/2026.
An office manager or campaign owner can record the channel, target market, responsible person, priority, and status without maintaining separate planning files. For example, the sample campaigns assign Emily, James, and Ashley as owners and use New York, Chicago, and Los Angeles as target markets.
During a Monday planning meeting, you can review dates and priorities on image 1, then move to the Dashboard in image 2 for totals. The workbook calculates a 58-day duration for the Spring Product Launch using the inclusive start-to-end date formula, while its $24,000 budget and $23,500 actual spend produce a $500 favorable variance.
This structure suits a small in-house team, an agency tracking client work, or a business owner coordinating email, paid search, social media, events, and referral activity. It is most useful when one person needs both the forward schedule and the financial outcome without switching between a calendar and a separate campaign report.
The workbook uses formulas rather than manual arithmetic for the main campaign metrics. Completion % divides Conversions by Leads, Duration (Days) calculates the inclusive date span, Budget Variance subtracts Actual Spend from Budget, and Cost per Lead divides Actual Spend by Leads. IFERROR protects these calculations when a row has no leads or incomplete values.
The Dashboard contains eight editable benchmark values: Email $18, Paid Search $42, Social Media $28, Events $65, Partnerships $35, Content $30, Display Ads $48, and Referral $22. A VLOOKUP matches the selected channel to its benchmark, and the Performance Flag returns On Track when Cost per Lead is at or below Expected CPL; otherwise it returns Review.
The Spring Product Launch shows 1,450 leads and 203 conversions. Its sample cost per lead is approximately $16.21, calculated as $23,500 divided by 1,450, compared with the Email benchmark of $18. The Paid Search Refresh has $37,200 of actual spend against a $36,000 budget, creating a negative $1,200 variance that deserves attention.
These figures are workbook examples, not industry standards or current market rates. Treat the benchmark cells as planning assumptions and replace them with the CPL targets your team uses for each channel.
The most expensive mistake in campaign planning is allowing inconsistent labels to split one channel into several categories. If one row says Paid Search and another says paid search, the Dashboard lookup may not match the intended benchmark, leaving Expected CPL at zero and making the Performance Flag unreliable.
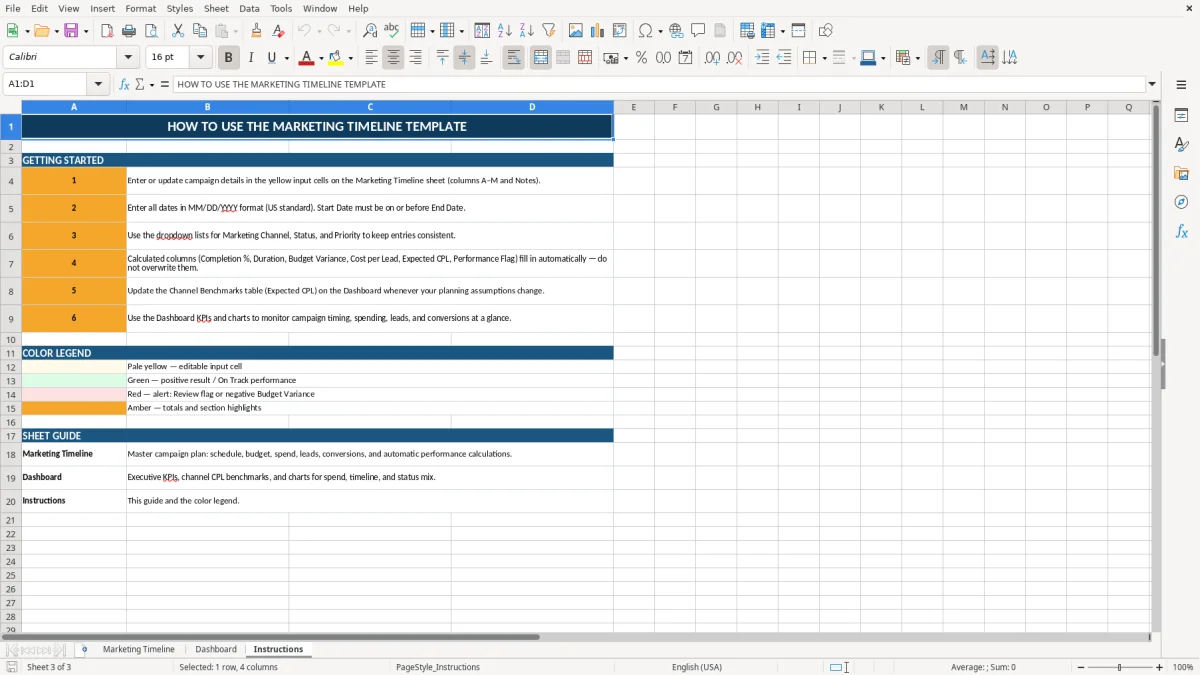
A Start Date after an End Date produces an unusable duration. The Instructions tab specifically requires MM/DD/YYYY entries and says the Start Date must be on or before the End Date. A campaign entered as 08/14/2026 to 06/01/2026 would not describe a valid 75-day schedule; correct the dates before using the Dashboard timeline chart.
Entering $3,720 instead of $37,200 changes the Paid Search Refresh cost per lead from about $37.96 to about $3.80. That single misplaced digit can make an over-budget campaign appear efficient and may cause a manager to increase spending based on a false result.
Do not overwrite the calculated columns N through S. Replacing a formula with a typed value can freeze one row while the rest of the sheet updates, creating a report where the visible KPI totals and campaign-level figures no longer agree.
Use one fixed update point each week, preferably immediately before the campaign meeting. Update Actual Spend, Leads, Conversions, Status, and Notes first; then review the calculated columns and Dashboard. This order keeps the input fields separate from the formulas that report performance.
When your planning targets change, update the eight Expected CPL cells in the Dashboard benchmark table rather than editing individual campaign formulas. This preserves the VLOOKUP relationship and applies the same assumption consistently across the timeline.
The workbook has 9 prepared campaign rows and no Excel table or automatic row expansion. Once your active plan exceeds the prepared area, move to a larger planning system or add capacity only after testing the formulas, formatting, validation lists, and Dashboard references. Keep the XLSX file as a focused campaign tracker rather than treating it as a full project-management platform.
It includes Marketing Timeline, Dashboard, and Instructions tabs. The timeline tracks campaign details, dates, budgets, spend, leads, conversions, and notes; the Dashboard provides KPIs, channel benchmarks, and three charts.
Enter campaign details in columns A–M and Notes, including campaign ID, name, channel, owner, market, dates, status, priority, budget, actual spend, leads, and conversions. Completion %, Duration, Budget Variance, Cost per Lead, Expected CPL, and Performance Flag are calculated.
The workbook compares Cost per Lead with the Expected CPL found for the selected channel. It returns On Track when Cost per Lead is at or below the benchmark and Review when it is higher.
Yes. Update the Expected CPL values in the Dashboard's Channel Benchmarks area. The Marketing Timeline uses those values to calculate each campaign's benchmark and Performance Flag.
Enter dates in MM/DD/YYYY format, such as 06/01/2026. The Start Date must be on or before the End Date so the Duration (Days) calculation remains meaningful.
The Marketing Timeline contains prepared rows 3 through 11, providing 9 campaign rows. The workbook does not contain an Excel table or automatic row-expansion feature, so test any added rows before relying on Dashboard totals.