Case Tracker Excel – Free Template (2026)
4
Free download
Evaluate up to 10 options across six weighted criteria with 1–5 scoring, rankings, recommendations, and a Dashboard in XLSX format.


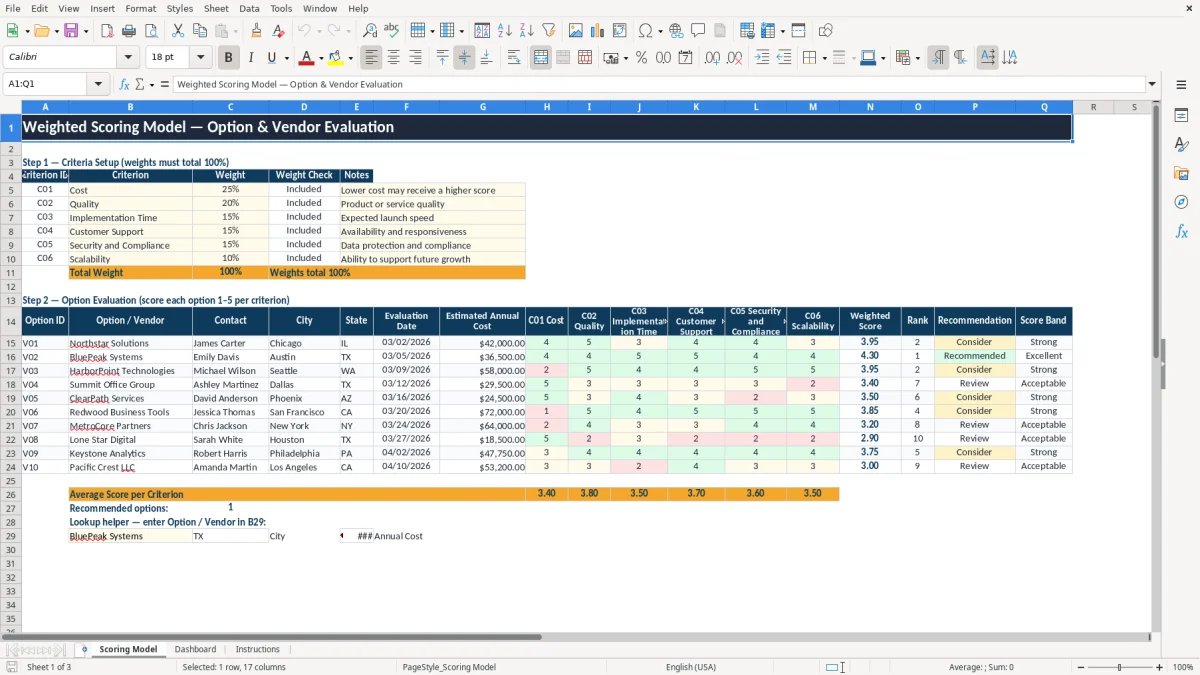
This weighted scoring model Excel workbook compares options or vendors by assigning percentage weights to six criteria and scores from 1 to 5. It contains a Scoring Model tab for inputs and calculations, a Dashboard tab for rankings and charts, and an Instructions tab explaining the scoring method.
You can evaluate up to 10 populated option rows using criteria such as Cost, Quality, Implementation Time, Customer Support, Security and Compliance, and Scalability. The workbook calculates each weighted score, rank, recommendation, and score band after you enter the decision data.
A weighted scoring model helps a purchasing manager, operations lead, project committee, or small-business owner compare choices when price is only one part of the decision. A software buyer may weigh Cost at 25%, Quality at 20%, Implementation Time at 15%, Customer Support at 15%, Security and Compliance at 15%, and Scalability at 10%, matching the populated criteria on the Scoring Model tab.
The workbook is useful during vendor selection, project prioritization, software evaluation, and annual planning. A team can score three accounting platforms, for example, then discuss why one received a 4 for quality but only a 2 for implementation time rather than choosing solely from a sales quote.
An office manager comparing service providers can enter the vendor name, contact, city, state, evaluation date, and estimated annual cost in columns B through G. The cost figure remains a reference field; the decision is driven by the six scores and the weights assigned to the criteria.
A project committee can use the same structure to compare internal initiatives. Security and Compliance may deserve a larger weight than the sample 15% when handling sensitive information, while Implementation Time may matter more when a launch date is fixed. The Instructions tab specifically identifies vendor selection, project prioritization, and software evaluation as suitable uses.
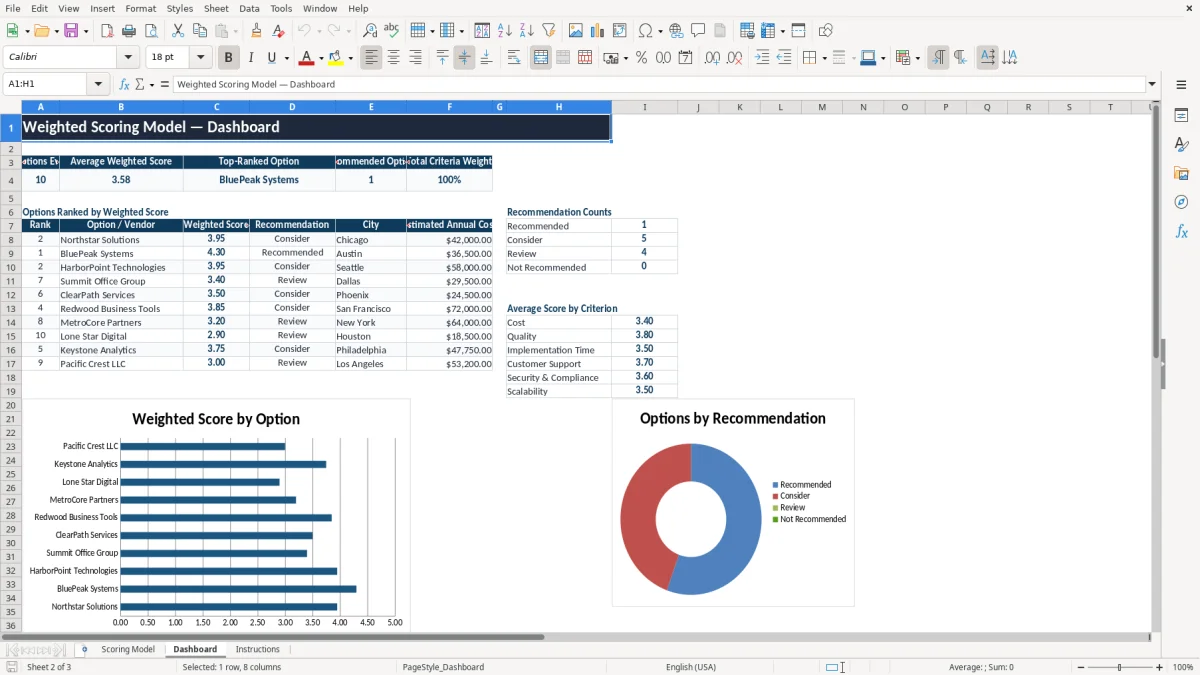
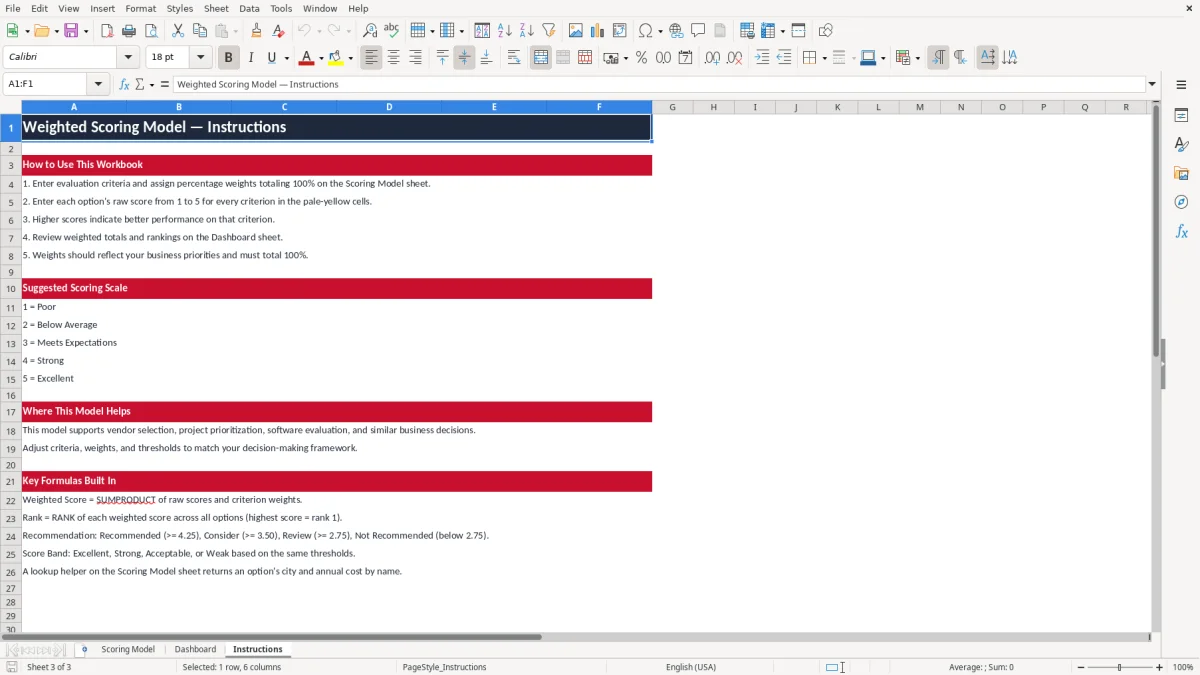
Image 1, the Scoring Model tab, shows the criteria setup above the option evaluation grid and calculated columns for Weighted Score, Rank, Recommendation, and Score Band. Image 2, the Dashboard tab, summarizes the ranked options and displays three charts. Image 3, the Instructions tab, explains the scale and formulas in plain language.
The model uses percentage weights that must total 100%. In the populated setup, Cost is 25%, Quality is 20%, Implementation Time is 15%, Customer Support is 15%, Security and Compliance is 15%, and Scalability is 10%. The Weight Check column marks criteria with positive weights as Included, while the Total Weight check tells you to adjust weights unless the sum equals 100%.
Each option receives a whole-number score from 1 to 5 for every criterion. The weighted score is the sum of each raw score multiplied by its criterion weight. For instance, an option scoring 4 on Cost, 5 on Quality, 3 on Implementation Time, 4 on Customer Support, 5 on Security and Compliance, and 3 on Scalability would calculate as 4 × 25% + 5 × 20% + 3 × 15% + 4 × 15% + 5 × 15% + 3 × 10% = 4.10.
The workbook labels a score of 4.25 or higher Recommended, 3.50 through 4.24 Consider, 2.75 through 3.49 Review, and anything below 2.75 Not Recommended. The related Score Band uses Excellent, Strong, Acceptable, and Weak for those same ranges.
Rank 1 represents the highest weighted score among the option rows. The Dashboard uses formulas such as AVERAGE, INDEX, MATCH, and COUNTIF to show the average score, identify the top-ranked option, count recommendations, and bring the evaluation results into the ranked table.
Keep the meaning of a 1, 3, or 5 consistent across every option. The Instructions tab defines 1 as Poor, 2 as Below Average, 3 as Meets Expectations, 4 as Strong, and 5 as Excellent. A score should reflect the same evidence standard for each vendor rather than a different scale for each row.
The most damaging error is allowing the weights to drift away from 100%. If Cost, Quality, and the other four criteria add to 90%, the resulting weighted totals no longer represent a complete decision model. The Scoring Model tab includes a Total Weight check specifically to expose that problem before you compare ranks.
A second failure occurs when evaluators treat every criterion as equally important even though the business does not. Giving a low-risk office purchase the same practical emphasis on implementation speed and security as a sensitive software deployment can produce a ranking that looks precise but reflects poor priorities.
If nearly every vendor receives 4 or 5, the model cannot separate the choices. The workbook provides only five scoring levels, so reserve a 5 for genuinely Excellent performance and use 2 or 3 when the evidence supports Below Average or Meets Expectations. A vendor with six scores of 5 should be exceptional, not merely familiar.
Leaving contact, evaluation date, annual cost, or city blank makes later review harder even though those fields are not part of the weighted calculation. More importantly, an empty criterion score prevents a meaningful comparison. Enter all six scores for each evaluated option and document the source of the assessment in your meeting notes or procurement records.
Rank 1 only tells you which option scored highest among the rows entered. It does not prove that the option is affordable, compliant, or suitable for your operating environment. Compare the rank with the Estimated Annual Cost, the individual criterion scores, and the Recommendation label before approving a purchase.
Do not confuse the Dashboard's Average Weighted Score with a budget average. It is an average of option scores, while Estimated Annual Cost remains an option-level reference value. The workbook does not calculate total purchase cost, savings, or return on investment.
Use the workbook at a defined decision point rather than treating it as a one-time worksheet. For a vendor review, set the evaluation date, collect the same evidence for every option, and hold one scoring meeting where the team agrees on the six weights before discussing the final ranking.
Start meetings on the Dashboard. The ranked list shows the option name, weighted score, recommendation, city, and estimated annual cost, while the charts summarize recommendation counts and average scores by criterion. If two options are close, return to the Scoring Model tab and examine the six component scores rather than relying on rank alone.
Weights should change only when the decision priorities change. For example, increasing Security and Compliance from 15% to 25% requires reducing other criteria so the Total Weight remains 100%. Record why the change was made; otherwise, two saved evaluations may appear inconsistent even when the underlying options did not change.
This XLSX workbook is best for a structured comparison with up to 10 prepared option rows and six criteria. Move to a dedicated procurement or project-management system when you need approvals, audit history, many simultaneous users, supplier records, or a larger database than this workbook provides.
A weighted scoring model compares options by assigning each criterion a percentage weight and each option a score from 1 to 5. The workbook multiplies each score by its criterion weight, adds the results, and ranks the options by weighted score.
The Scoring Model tab includes six criteria and prepared evaluation rows for 10 options, from rows 15 through 24. You can edit the criterion names and weights to fit your decision framework.
The six criterion weights must total 100%. The workbook displays a Total Weight check and labels the setup Adjust weights when the total is not 100%.
A weighted score of 4.25 or higher is Recommended, 3.50 or higher is Consider, 2.75 or higher is Review, and a score below 2.75 is Not Recommended. The corresponding score bands are Excellent, Strong, Acceptable, and Weak.
The Dashboard tab displays the Top-Ranked Option in its summary area and lists all entered options by rank. It also shows the average weighted score, recommended-option count, total criteria weight, and three charts.