Case Tracker Excel – Free Template (2026)
4
Free download
Track root-cause investigations with 5 Whys Analysis, status metrics, department charts, corrective actions, and instructions in XLSX format.


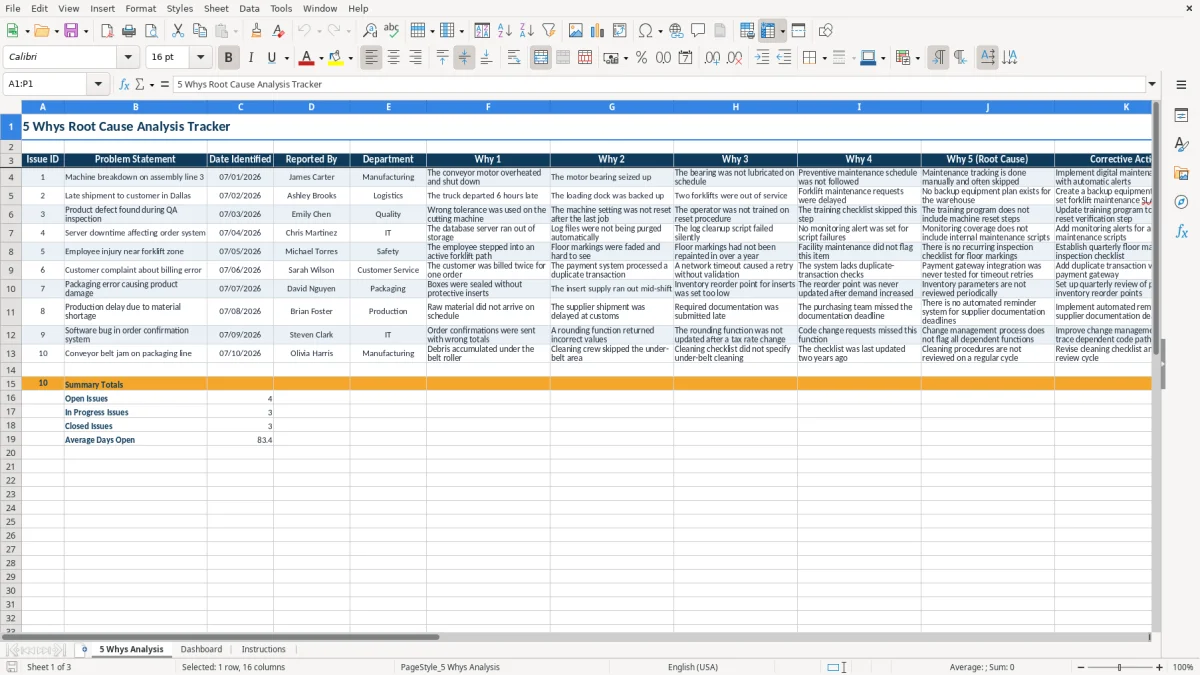
This 5 Whys workbook records problems, five layers of cause analysis, corrective actions, owners, target dates, priorities, and status. The XLSX file includes a 5 Whys Analysis sheet for up to 10 prepared issue rows, a Dashboard with calculated metrics and charts, and an Instructions sheet.
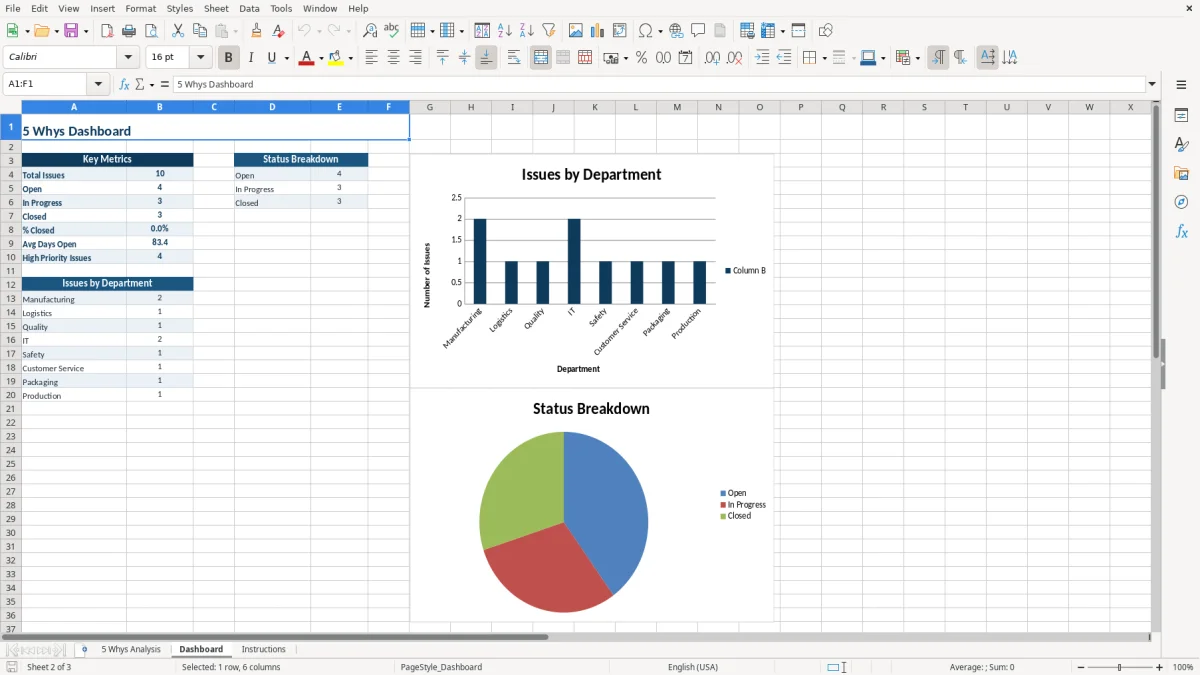
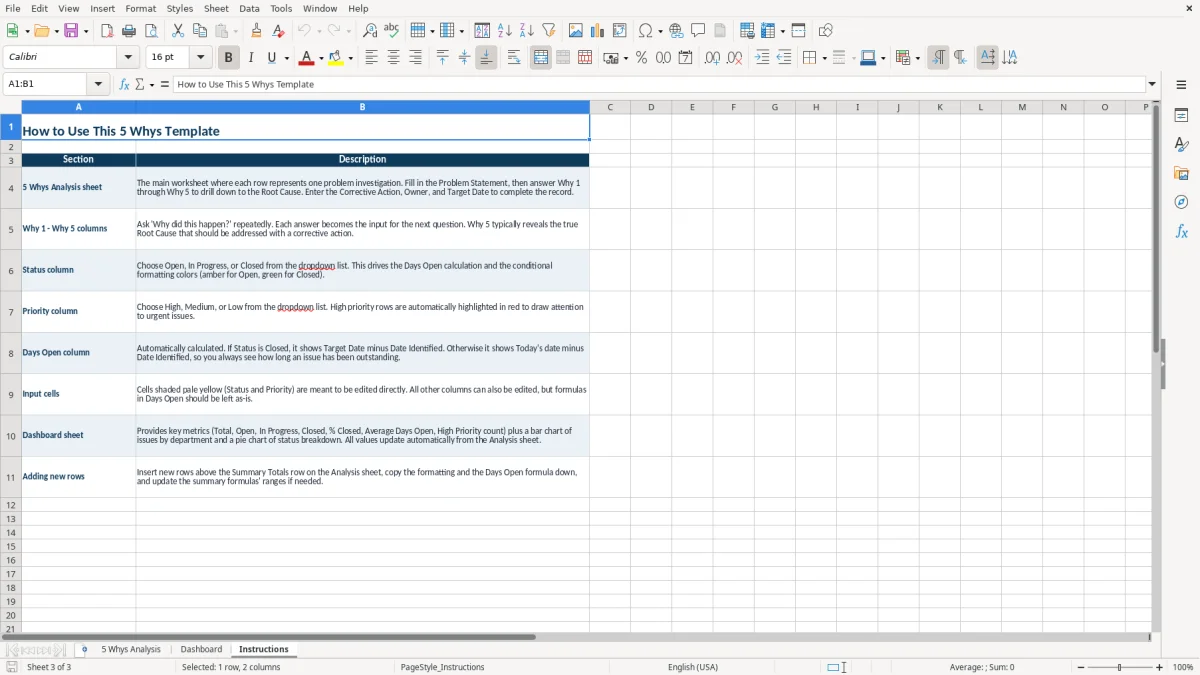
Use it for manufacturing defects, equipment failures, shipping delays, safety concerns, or service problems. Image 1 shows the main analysis grid; image 2 shows the dashboard; the Instructions tab explains the fields and formulas.
A production supervisor can use this workbook after a machine failure, a quality manager can use it after a defect, and a logistics manager can use it after a late shipment. The sample rows show three concrete cases: an assembly-line breakdown, a Dallas shipment delay, and a product defect found during quality inspection.
Start with the event rather than a suspected solution. For the sample assembly-line issue, the five answers move from an overheated conveyor motor to a seized bearing, missed lubrication, an un followed preventive-maintenance schedule, and manual maintenance tracking that is often skipped. That chain gives the team a more useful corrective action than simply replacing the motor.
The Department field lets a manager distinguish Manufacturing, Logistics, and Quality work from IT, Safety, Customer Service, Packaging, or Production issues. The Dashboard counts these departments separately, which helps an operations meeting focus on where investigations are accumulating instead of relying on anecdotal updates.
This format also suits a small warehouse, plant, or service operation that needs a shared issue register without introducing a separate system. One row contains the investigation and its follow-up, while the Owner and Target Date fields make responsibility visible.
The workbook uses three permitted status values: Open, In Progress, and Closed. The Status column drives the Days Open calculation, while the Dashboard counts each status with COUNTIF formulas and calculates the closed percentage from the closed count divided by total issues.
For an active issue, Days Open uses today's date minus Date Identified. For a closed issue, it uses Target Date minus Date Identified. In the sample, the quality issue identified on 07/03/2026 is marked Closed with a target date of 07/18/2026, so the calculated duration is based on 15 days rather than continuing to increase.
Status and Priority use list validation, which limits entries to the workbook's defined choices. The analysis rows are prepared through row 13, and the Dashboard formulas reference those rows. Days Open, summary counts, average duration, and charts are calculated outputs; the issue descriptions, five why answers, actions, owners, dates, and selections are user inputs.
The workbook is an operational tracker, not a live database. If you add rows above the summary totals, follow the Instructions sheet: copy the formatting and Days Open formula down, then update summary ranges as needed.
The most damaging failure is stopping at the first visible cause. In the sample late-shipment investigation, the truck left six hours late, but the analysis continues through dock congestion, two failed forklifts, delayed maintenance requests, and the absence of a backup-equipment plan. Recording only the six-hour delay would point the team toward the symptom instead of the control problem.
Answers such as employee error or equipment problem do not explain what process allowed the issue to occur. A useful Why 5 should be specific enough to support the Corrective Action field, such as adding reset verification to the training program or creating a backup-equipment plan with a maintenance service-level agreement.
An action without an Owner or Target Date cannot be managed during a follow-up meeting. The sample rows show named owners and dates such as 07/15/2026, 07/18/2026, and 07/20/2026. Leaving those fields blank makes the Dashboard's open and in-progress counts look complete while the underlying work remains unassigned.
Another breakdown occurs when users overwrite Days Open or type inconsistent status labels. A single entry such as In progress instead of In Progress will not match the list-driven formulas, so the dashboard can undercount the real workload.
Choose one recurring review time, such as the weekly production meeting or the logistics team's Monday operations review. Before the meeting, update Status, Owner, Target Date, and corrective-action notes; during the meeting, use the Dashboard to decide which open or high-priority investigations need attention.
Do not select Closed merely because an action was assigned. Mark an issue closed after the corrective action has been completed and the responsible team has verified the result. The closed duration then uses the target date and remains stable instead of continuing to use today's date.
The workbook is a practical starting point for the prepared analysis area. If your team regularly manages more than the available rows, needs several investigators editing simultaneously, or requires audit history and notifications, move the process into a dedicated quality or operations system rather than relying on manual range updates.
It contains 5 Whys Analysis, Dashboard, and Instructions tabs. The analysis sheet includes 16 fields, including five why columns, corrective action, owner, target date, status, priority, and Days Open.
The analysis area has prepared rows for Issue IDs 1 through 10. The Instructions sheet explains how to insert additional rows above the summary totals and copy the required formatting and formula.
The Status dropdown contains Open, In Progress, and Closed. These values drive the Days Open calculation and the Dashboard status counts.
For an issue marked Closed, Days Open equals Target Date minus Date Identified. For Open or In Progress issues, it equals today's date minus Date Identified.
The Dashboard shows total issues, Open, In Progress, Closed, percentage closed, average Days Open, and high-priority issue count. It also includes charts for issues by department and status breakdown.
Yes, the Instructions tab describes the manual process: insert rows above the Summary Totals row, copy the formatting and Days Open formula, and update summary formula ranges if necessary.