Case Tracker Excel – Free Template (2026)
4
Free download
Track improvement initiatives, owners, targets, status, impact scores, estimated benefits, and dashboard summaries in an XLSX workbook.


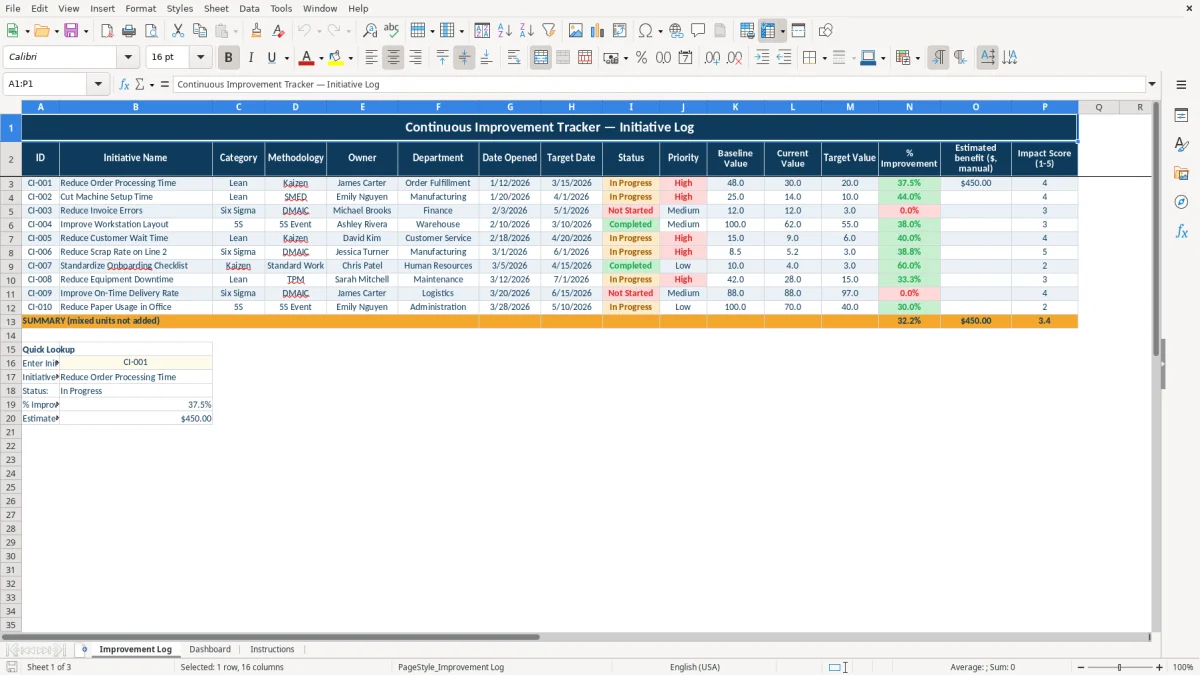
This continuous improvement workbook records initiatives, owners, departments, dates, status, priority, baseline and target values, calculated improvement, estimated benefits, and impact scores. It includes an Improvement Log, Dashboard, and Instructions tab for reviewing up to 10 prepared initiative rows.
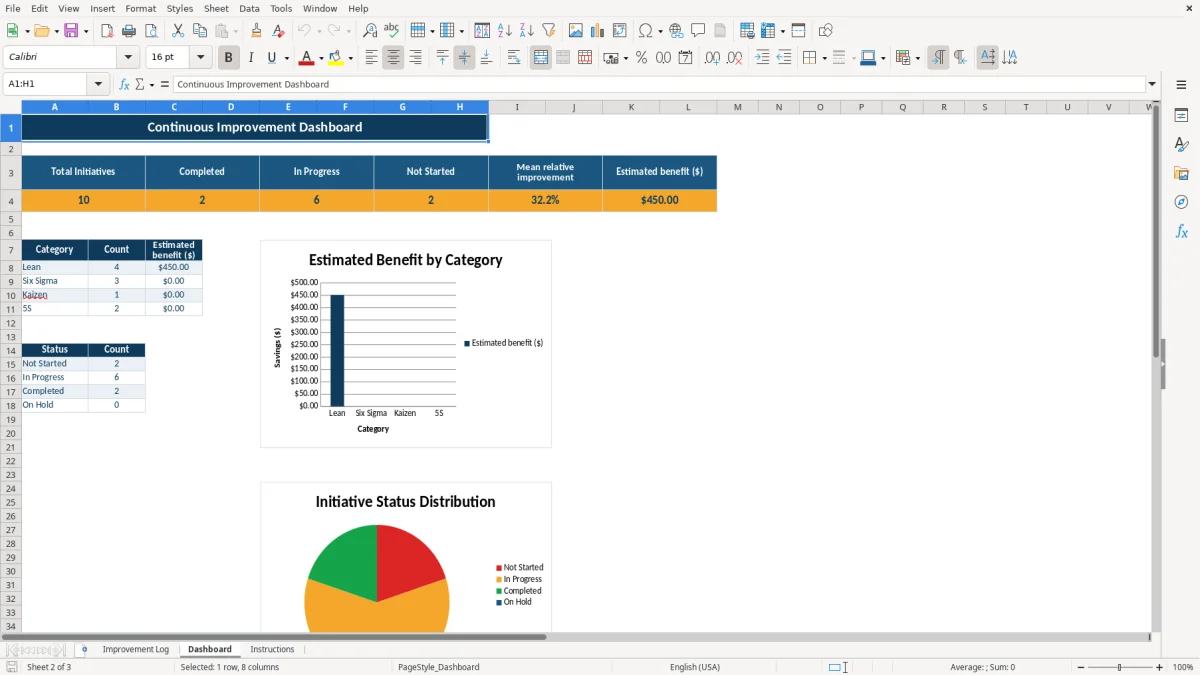
Use the Improvement Log to document Lean, Six Sigma, Kaizen, or 5S work with consistent measurements. The Dashboard summarizes initiative counts, status, category, mean relative improvement, and manually entered estimated benefits, while the Instructions tab explains the workbook's calculations and lookup area.
A continuous improvement log gives an operations manager, production supervisor, office manager, or department lead one place to track work that would otherwise remain in meeting notes. A manufacturer might record a setup-time project in minutes, while a finance team tracks invoice errors per billing cycle. The important choice is to define the measurement before entering the numbers.
A plant supervisor can assign an initiative such as reducing machine setup time to a named owner and department, then enter the baseline, current, and target values. In the workbook's sample, the setup-time initiative uses 25 as the baseline, 14 as the current value, and 10 as the target. Those numbers are sample workbook data, not a production benchmark.
An office manager can track order processing time, invoice errors, or another repeatable process measure. The Improvement Log includes fields for methodology and category, so a team can distinguish Lean, Six Sigma, Kaizen, and 5S work rather than combining unrelated projects in one undifferentiated list.
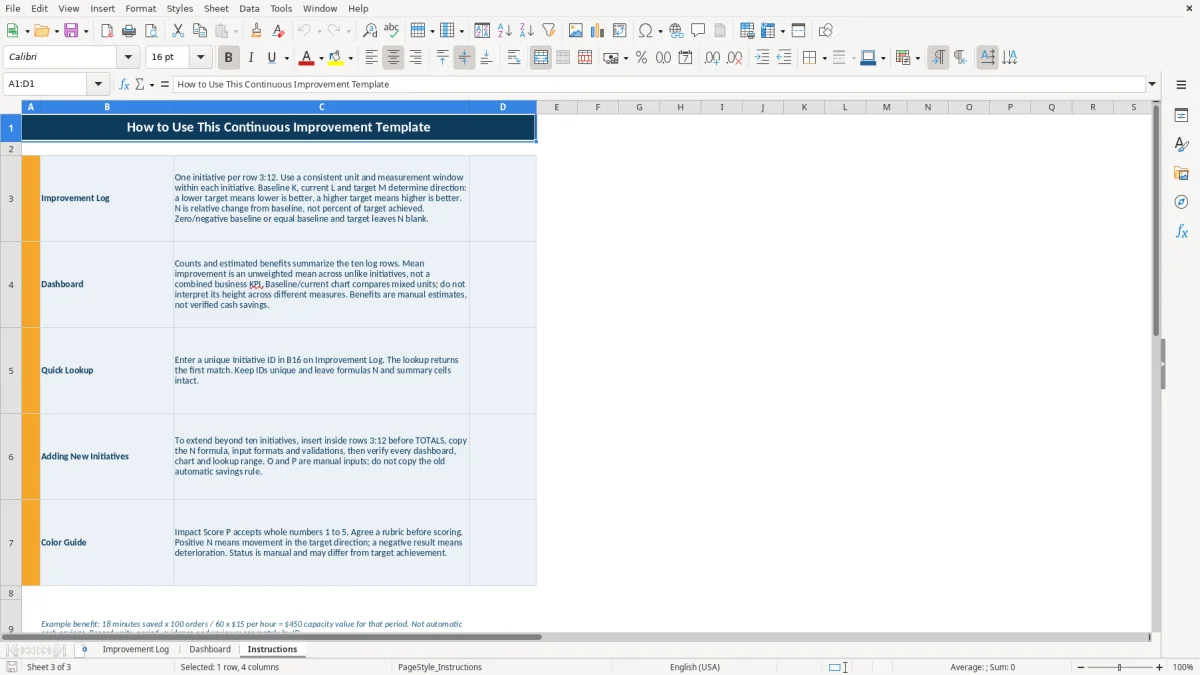
The Dashboard, shown in image 2, summarizes the initiatives by status and category. Image 1 shows the Improvement Log layout, including the 10 prepared entry rows, measurement columns, manual benefit field, and impact score. Image 3 shows the Instructions tab, which explains how to maintain consistent units and interpret the calculated result.
The workbook calculates relative improvement from the baseline, current, and target values in columns K, L, and M. When the target is lower than the baseline, the formula uses the reduction from baseline to current; when the target is higher, it uses the increase. This lets you track measures such as processing time and output volume with the same field.
Do not compare 48 minutes per order from one week with 30 minutes per order from a different operating period unless the difference is meaningful. Record the unit and period in the initiative's supporting records, then use matching measurement windows in the three numeric columns. The formula returns a blank when the required values are incomplete, the baseline is not positive, or baseline and target are equal.
Estimated benefit is a manual dollar entry in column O. The Instructions tab gives a sample calculation of 18 minutes saved across 100 orders at $15 per hour, producing $450 of capacity value for that period. The workbook does not automatically convert time, volume, or labor rates into savings, so label the period and evidence outside the sheet.
The Dashboard's mean relative improvement is an unweighted average of the log's improvement results. It should not be presented as a combined business KPI when initiatives use different units. Its estimated benefit total is a sum of entered dollar amounts, not verified cash realization.
The most damaging failure is mixing units or periods. If one row measures minutes per order and another measures weekly orders, the Dashboard can calculate both percentages, but their average does not describe one combined operational result. The Instructions tab explicitly identifies mean improvement as an unweighted average across unlike initiatives.
A team may enter a baseline of 12 invoice errors, a current value of 12, and a target of 3. The current result shows no improvement yet, which is useful. Changing the measurement window halfway through the project can make a flat process appear improved or deteriorated without any real process change.
Entering $450 in estimated benefit does not mean the company has received $450 in cash. The workbook's own example describes capacity value from saved minutes, not automatic savings. Treat the amount as an estimate and document the volume, rate, period, and reviewer in your normal project records.
Duplicate IDs create a separate problem. The lookup returns the first matching record, so two rows labeled CI-001 can send a manager to the wrong initiative. Keep every ID unique, preserve the formulas in the calculated and lookup areas, and do not overwrite Dashboard summary cells with typed numbers.
Set a fixed review time, such as the last 15 minutes of a weekly operations meeting. The owner updates the current value, status, and evidence before the meeting; the manager then reviews priority and impact rather than spending the meeting reconstructing old numbers.
Enter data only in the prepared input fields and leave formula cells in column N, the totals area, Dashboard summaries, and lookup cells intact. If you need more than 10 initiatives, follow the Instructions tab: insert rows inside the prepared log area, copy the formulas and validations, and verify every Dashboard, chart, and lookup range.
For a small team with a handful of initiatives, this XLSX format is practical. When you need live multi-user updates, a larger project history, permissions, or workflow alerts, move the process to a dedicated project or operations system instead of relying on increasingly complex workbook edits.
The Improvement Log has 10 prepared initiative rows, from rows 3 through 12. The Instructions tab explains how to insert additional rows, copy formulas and validations, and verify the Dashboard, charts, and lookup ranges afterward.
It compares the baseline, current, and target values. A lower target calculates the reduction from baseline, while a higher target calculates the increase; incomplete or invalid measurement inputs return a blank result.
No. Estimated benefit is a manual dollar input in column O. The Dashboard sums the entered amounts, but the workbook does not calculate cash savings from time, volume, labor rates, or other assumptions.
Category choices are Lean, Six Sigma, Kaizen, and 5S. Status choices are Not Started, In Progress, Completed, and On Hold; priority choices are Low, Medium, and High.
Enter a unique Initiative ID in cell B16 on the Improvement Log. The lookup returns the first matching initiative name, department, improvement result, and estimated benefit, so duplicate IDs should be avoided.